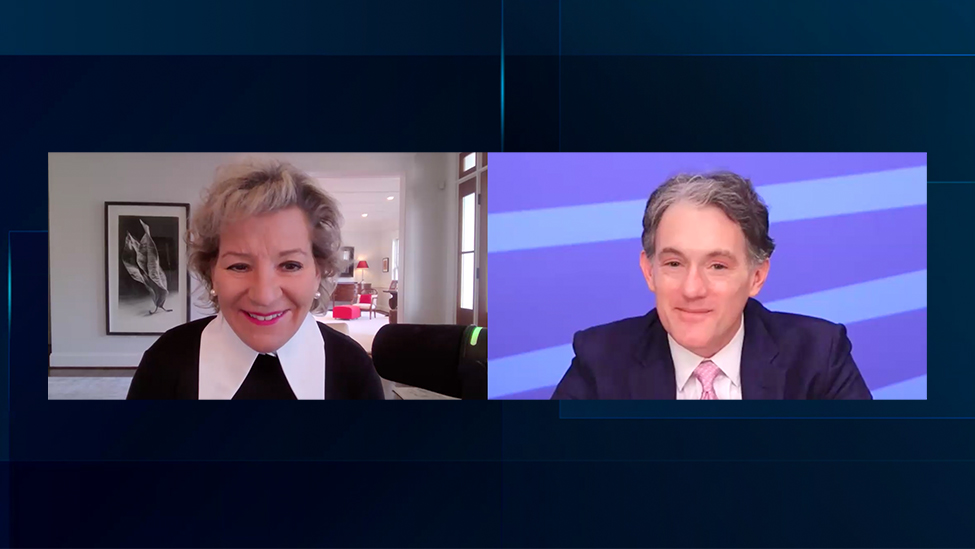
A Tale of Two Economies with Marisa DiNatale of Moody’s

A Tale of Two Economies with Marisa DiNatale of Moody’s
July 15, 2026
Wednesday 1:00 p.m.-2:00 p.m. ET

The Travelers Institute hosted Marisa DiNatale, Senior Director and Head of Global Forecasting at Moody’s Analytics, for a deep dive on the economy. She shared her macroeconomic outlook and her perspective on what businesses and individuals should be watching in the months ahead.
This program is presented as part of the Travelers Institute’s Forces at Work initiative, an educational platform to help today’s leaders navigate the shifting dynamics of the modern workplace and prioritize employees and their well-being.


(SPEECH)
[MUSIC PLAYING]
(DESCRIPTION)
Slide, Text, Wednesdays with Woodward (registered trademark) Webinar Series. An open laptop displays the opening slide. Logos, Travelers Institute, (registered trademark) Travelers. Jessica Kearney, Vice President, Public Policy, Travelers Institute.
(SPEECH)
JESSICA KEARNEY: Hello, and welcome to Wednesdays with Woodward. My name is Jessica Kearney, Vice President here at the Travelers Institute. And I'm standing in for our host today, Joan Woodward. I'm so glad you could be with us.
Before we get started, as always, I'd like to share a short disclaimer about today's program.
(DESCRIPTION)
Text, About Travelers Institute (registered trademark) Webinars.
The Wednesdays with Woodward (registered trademark) educational webinar series is presented by the Travelers Institute, the public policy division of Travelers. This program is offered for informational and educational purposes only. You should consult with your financial, legal, insurance or other advisors about any practices suggested by this program. Please note that this session is being recorded and may be used as Travelers deems appropriate.
(SPEECH)
And I'd also like to thank all of our wonderful program partners, the Master's in FinTech at UConn and their School of Business, the MetroHartford Alliance, the Connecticut Business & Industry Association, the Risk and Uncertainty Management Center at the Darla Moore School of Business and the Insurance Association of Connecticut. Special welcome to all of our partners and their members. Thanks for being with us.
(DESCRIPTION)
A Tale of Two Economies with Marisa DiNatale of Moody's Analytics. Logos, Travelers Institute (registered trademark), Master's in Financial Technology (FinTech) Program at the University of Connecticut School of Business, MetroHartford Alliance, Connecticut Business & Industry Association (CBIA), Insurance Association of Connecticut (IAC), The University of South Carolina Darla Moore School of Business.
(SPEECH)
All right, so we're going to jump right in because we have a lot to cover today. If you've been following the economy at all over the past few months, you've likely noticed some contrasting headlines. Consumer sentiment is near an all-time low, but the stock market is near an all-time high. Geopolitical conflict and trade tensions threaten growth, but momentum and investment in AI have given the economy a boost. And we've seen an uptick in inflation but softer job growth.
To help us to unpack all these moving parts in our economy, I am so thrilled to be joined by Marisa DiNatale, who's the Senior Director and Global Head of Forecasting at Moody's Analytics, where she oversees macroeconomic forecasting and publication operations in the Economics group.
(DESCRIPTION)
Text, Today's Speaker, Marisa DiNatale, Senior Director and Global Head of Forecasting, Moody's Analytics.
(SPEECH)
Her areas of specialization and research include the U.S. labor markets, household balance sheets and credit, as well as international economics. She's a co-host of the weekly Inside Economics podcast-- definitely check that out if you're not already a listener-- with another of our past webinar guests, Moody's Chief Economist Mark Zandi, who's joined us in the last year or so.
So to kick things off today, Marisa is going to give us an overview of the current state of the economy. And then I'm going to join her on the other side for a moderated discussion, and of course, your questions. So as Marisa is presenting, coming up over the next few minutes, please feel free to drop your questions in the Q&A ribbon at the bottom of your screen.
Marisa, welcome. Thank you so much for your time. Thank you for being here. I'm going to turn the floor over to you for our economic outlook.
(DESCRIPTION)
Moody's, The Economic Outlook, A Tale of Two Economies. Please attribute information in this document to Moody's Analytics, which is a division within Moody's that is separate from Moody's Ratings. Accordingly, the viewpoints expressed herein do not reflect those of Moody's Ratings. July 2026.
(SPEECH)
MARISA DINATALE: Thanks, Jessica. It's really nice to be here. Thanks for having me and thank you to everyone who's joining. Looking forward to answering your questions. I'm going to take about 25 minutes or so, and I'm going to give you a high-level view of our current forecast for 2026 and 2027. We update our forecast, our baseline forecast, and about nine alternative scenarios around that baseline every single month. So in the past week or so, we just completed our forecast for July.
I will say forecasting in this environment is quite difficult these days because things seem to be changing very, very rapidly with all of the policy changes, with the conflict with Iran, which seems to be kind of off and on depending on the day. So it's a challenge, but I'm going to talk through how we're thinking about the current economic environment, the things we're watching and the things we think you should watch, too. So I'll just dive right into it.
(DESCRIPTION)
Tug of War Between De-globalization and War and AI and Policy. Projected contributions to change in 2026 real GDP growth, 4qrt to 4qrt, ppt. A tug of war graphic appears between Headwinds in red, on the left, and Tailwinds in green, on the right. Headwinds, -0.88. De-Globalization, -0.57. Tariffs and Trade Restrictions, -0.21. Restrictive Immigration Policy, -0.36. Iran War, -0.31. Tailwinds, +1.1. Artificial Intelligence, +0.60. Capital Investment, +0.27. Stock Wealth Effects, +0.33. Economic Policy, +0.41. Monetary Policy, +0.00. Fiscal Policy, +0.41. Source, Moody's Analytics.
(SPEECH)
So the economy is performing pretty well, actually, I think probably, I would say better than a lot of people expected, given some of the headwinds we've faced. Some of this is fortuitous timing, because at the same time that we've had headwinds that are slowing economic growth, we've also had some beneficial tailwinds happening at the same time that are sort of separate from those headwinds and is just fortuitous timing that have helped to offset some of the dampeners to growth.
So the economy is growing about 2%. It grew 2%. This is GDP growth that I'm talking about, 2% in 2025. Our forecast is that it continues to grow just about 2% in 2026 and 2027. We expect that growth over the course of this year will slow as we go through the rest of this summer, and hopefully with an end to tensions in Iran in the next few months, we'll start to see some relief valve there, not only for growth but for inflation. And I'll talk about inflation in more depth in a little bit.
But really, we're looking at 2% growth. And that's OK. That's an OK rate of growth. I will say it is probably below the economy's rate of potential growth. We think the rate of potential growth is about 2.5%. If it were not for the Iran war, we would probably be right around 2.5% right now. So it's a decent pace of growth.
We are seeing a declining labor force because of immigration policy, as well as the aging baby boom generation, which is now in prime retirement years. That's taking some juice out of the economy, as well, and limiting how fast the economy can grow.
The good story here is that the advent of AI and artificial intelligence is doing a lot of the heavy lifting here. Now, I say it's a good story because it's helping to offset some of these headwinds that we're experiencing. So I have over here on the left the tariffs and the trade restrictions. That's taking about 0.6 percentage points off of growth, and immigration policy, as I mentioned, because it has basically slowed the labor force to a standstill, that's probably taking another 4/10 of a percentage point off of growth.
AI has come along and is juicing up capital investment by companies. It's juicing up some of the construction center for the construction of all of these data centers. And even more importantly, what it's doing is it's supporting household spending through the higher wealth effect. So AI is really helping to offset some of these negative trends we're seeing in the economy.
Additionally, and I'll speak to this a little bit more, we have new tax policy in place. This is the result of the One Big Beautiful Bill Act that was passed last summer. A lot of those tax provisions went into effect starting this year. And as a result, households saw, generally, on average, bigger tax returns this year when they filed their taxes than they did last year. So that's another benefit to growth and is helping to offset some of the negatives here.
I will also say that we run a model that predicts the probability of a recession over the next year. In normal times, so just in your average business cycle, the probability of recession in any given year forward is about 15%. Right now, this high frequency model that we run is telling us that the probability of recession occurring in the next year is about 30%. So that's quite high. If you look at that, relatively speaking, back where we have been over the past 10, 15 years, that's a pretty high probability of recession. So when I talk about the economy, I say it's good, it's growing, but I think the growth is pretty tenuous. And I'm going to go through some of the reasons why I think that is.
So as we move along here in this presentation, Jessica mentioned at the outset that there seems to be this disparity. There seems to be very bad consumer confidence. We get a couple reads on consumer confidence every month from The Conference Board and from the University of Michigan. And when people are asked about their own financial situations, when they're asked about their own perception of the economy, they are answering this extremely negatively.
(DESCRIPTION)
Why So Glum? The K-Shaped Economy! Share of personal outlays by income group, percent. A graph displays years from 1990 to 2025 on the X-axis, and personal outlays, from 40 to 60, on the Y-axis. A green line measuring the top 20% of the income distribution stalls between 48 and 53 in the '90s, then steadily increases over time toward 60. A blue line measuring the bottom 80% of the income distribution hovers high between 48 and 53 in the '90s, overtaking the green line for a few years. The blue line then dips down and continually recedes over time, closer to 40.
(SPEECH)
In fact, the results of consumer confidence surveys right now are even more negative than they were in the first few months of the pandemic, when the economy was completely shut down and there was a ton of uncertainty about just the state of the world moving forward. People right now are saying they feel even worse than they did back then. So confidence is kind of rock bottom.
At the same time, we have a stock market that's going gangbusters. I think we all know that that's being primarily driven by these AI hyperscaler Magnificent Seven stocks, but you have this disparity with what markets are saying and what people are saying, and why could that be?
Well, one reason I think is shown here. We talk about this. We refer to it as the K-shaped economy. I think it looks more like a set of grill tongs or something, but we can call it K-shaped. And what this really represents is this income disparity between the top buckets of the income distribution and the middle and the lower buckets of the income distribution.
So you can see this data goes back to 1990. Income and wealth disparity is nothing new. It's been around for a long time. But you can see that since-- really since the pandemic, this has widened. This disparity has widened. And that's where you really see this K shape, where the people at the top 20% of the income distribution have been doing much, much better and have been gaining ground, whereas the people at the bottom 80% of the income distribution are losing ground. And here I'm measuring that by growth in personal spending, personal outlays.
This is important because this is about 70% of our GDP growth. Consumer spending, that is, is about 70% of our consumer spending. So this is the bulk of what drives our economy is how people are spending. And the spending is really being done at the top. So again, going back to this theme of tenuousness, if you're having a very small slice of people, top 20%, kind of propelling the economy forward while the bottom 80% are doing less well, that's a little worrying, because if anything happens that rattles that top 20% and causes them to pull back, that is certainly a recipe for inflation.
(DESCRIPTION)
A Personal Outlays Growth chart measures Past year growth percentage for the bottom 80% at 2.6, top 20% at 6.5, and CPI inflation at 2.7. Over the past 3 years, the Bottom 80% grew by 2.3%, the top 20% grew by 7.4%, and CPI Inflation grew by 2.9%. Since the pandemic, the bottom 80% grew by 4.5%, the top 20% grew by 8.3%, and CPI Inflation grew by 3.9%. Text, Sources, Federal Reserve, Moody's Analytics.
(SPEECH)
So here you can see since 2020, personal outlays by the top 20% have grown about 60% since 2020, whereas for the bottom 80%, personal outlays have just outpaced inflation.
(DESCRIPTION)
The Well-to-Do are Thriving. Personal outlays by household income group since the pandemic, 2020 Q1 equals 100. A graph displays the years 2020 through 2026 on the X-axis and personal outlays, from 90 to 170, on the Y-axis. A dark blue line measures Lower income, zero to 39.9 percent. This line dips down below 100 for 2020, then slowly climbs to 130 in '26. A green line measures Middle income, 40 to 79.9%. This line stalls below 100 for 2020, then rises nearly in tandem with the dark blue line, to 130 in '26. A red line measures high income, 80 to 100%. This line dips below 100 for the first half of 2020, then takes off on a rapid, steady increase to 160 in '26. A light blue line measures CPI. This line stalls at 100 during 2020, then slowly, steadily increases to 125 in '26. The lower- and middle-income lines sit barely higher than CPI. Text, Sources, Federal Reserve, Moody's Analytics.
(SPEECH)
So inflation over this period, I'm measuring this by the consumer price index. Prices are up about 30% since 2020, and they're up just over 30%, about 31% for outlays for the middle and the lower end of the income distribution.
And just for some reference here, just to give you some sense of what I'm talking about when I say high income, the top 20%, this high-income cutoff, this is households that are making about $200,000 a year or more. That's the definition for that top group here that I'm referring to. The middle-income group, the cutoff is about $72,000 a year. So when I'm talking about the lower income, that's less than $72,000 a year. And again, this is based on an entire household.
So here you can really see this in stark relief, that the upper-income households are really doing the heavy lifting here in terms of spending. And I mean, this makes sense given some of the headwinds and some of the changes that we've seen over the past few years. So if you think about some of the policy that's been enacted, let's just talk about tariffs for a second.
Tariffs disproportionately hurt middle- and lower-income households, because those households do much more of their spending on goods than on services. If you're a high-income household, you're spending a lot more money on things like financial services, vacations, travel, entertainment, eating out, those kinds of things. If you're in the middle or the bottom of the income distribution, you're spending more on stuff-- food, gasoline, appliances, other kinds of durable and nondurable goods-- than you are on services. So the fact that the tariffs were put on goods, and a lot of those imported goods and a lot of it is food are being tariffed, that's a policy that's disproportionately hurting the middle- and the lower-income household families.
Same thing with immigration policy. That is much more likely to be disruptive in the labor market for middle-income and lower-income households, where you're more likely to have immigrants that are more likely facing-- more subject to the current immigration policy.
At the same time, if we focus on the top part of the case, so this would be the next slide that I'm showing, the story here is really the enormous surge in household wealth that has occurred.
(DESCRIPTION)
AI Powers Surging Household Wealth for the Top of the K.. Ratio of household net worth to disposable income. A graph displays the years 1950 to 2025 on the X-axis, and the net worth to disposable income ratio on the Y-axis, ranging from 4.0 to 8.5. A blue line zig zags up and down throughout the years. It hovers around 5.0 to 5.7 through the '50s and '60s, then lowers between 5.2 and 4.5 through the '70s. Starting in 1985, the value steadily increases back toward 5.5. In the early 2000s, the Y2K bubble peaks at 6.3, then lowers back to 5.6. The Housing Bubble follows shortly after, rising to 6.7. It dips sharply down to 5.5 in 2008. The line zigzags onward, generally trending upward. The line peaks sharply to 7.8 during the pandemic, in 2021. Text, Sources, Federal Reserve, B.E.A., Census, Moody's Analytics.
(SPEECH)
So two main drivers of wealth are housing wealth and stock market equity wealth. You can see that wealth, if we go back to the last recession or expansion, so right after the-- leading into the financial crisis, leading into 2008, there was a big run-up in housing wealth as people's housing values went sky high. Then you see that come back in as house prices crashed.
And then between 2010 and 2020, we had a good run in the stock market, but we also had pretty steady price appreciation in home prices. People in the top 20% of the income distribution are much more likely to own homes than rent homes, so any benefits to housing wealth are going to disproportionately affect them. At the same time, when we talk about the stock market performance, again, people in the top 20% of the income distribution are much more likely to be either directly or indirectly invested in the stock market, so they have enjoyed the benefits of both rising home prices and a rising stock market.
And you see, since 2020, since the pandemic, if you can remember back five years ago how the housing market was in the midst of the pandemic, people were moving. People were moving out of coastal, high-income areas to lower priced areas. The housing market was going pretty crazy, and we had rock bottom interest rates. So if you're like me, you may have refinanced your mortgage during these few months coming out of the pandemic, and we were looking at mortgage rates that were under 3%. That's a very different environment from now. So back then, housing prices were juiced up by all this demand and higher affordability due to lower mortgage rates, so we saw a huge increase in housing wealth.
And then, of course, since 2022, since ChatGPT was rolled out in November of 2022, we've seen enormous equity gains coming from the stock market, and that has helped the wealthy, as well. So this all goes back to what I call the wealth effect. So this is the sense that if you look wealthier on paper, you're more likely to spend in real life.
So we can all get estimates of what our home is worth if we go on Zillow. It may or may not be correct, but we can do that. We have some sense of what our homes are worth, and we can very easily look and see what our stock holdings are worth and what the value of our 401(k) is. And so for every additional dollar in equity market wealth, people tend to spend about 5 cents for every dollar. So it does spur some psychological shopping, if you will, goes on where people say, I can afford to take this vacation or I can afford to eat out more, or whatever it may be. That's the wealth effect.
There's also, I should say, the risk here is that the opposite happens when wealth falls. So if we were to get a stock market crash, if we were to see house prices decline precipitously like we did back in 2008, then the same thing happens on the reverse. People are much more likely to pull back on their spending, and there's some evidence that they would pull back more on the downside than they would tend to spend more on the upside. So there's some asymmetry there. So this is what's really propelling the top part of the income distribution.
So on the next few parts of this talk, I want to focus on the bottom part of that K and what's going on with the vast majority of households, which is people in the bottom 80% of the distribution.
(DESCRIPTION)
Job Growth is Volatile, Inflation Accelerates Since Liberation Day. A graph lists months from January 2025 to June 2026 on the X-axis. On the left edge, it measures Job growth, average monthly job growth, 3-month Moving average, Ths., which ranges from minus 100 to plus 200. On the right edge, it measures PCE inflation, year over year percent change of a 3-month moving average, which ranges from 2.2 to 4.0. Blue bars measure job growth while a green line measures PCE inflation. Job growth sits above 100 in January of '25, then drops to 75 at Liberation Day in April of '25. Growth stalls, then dips down to minus 50 in October of '25. After a few low months, growth climbs upward to 160 in May of '26. The green inflation line hovers between 2.3 and 2.8 for the first half of the graph. It climbs higher beginning in January of '26, then reaches 3.7% in May. Text, Sources B.L.S., B.E.A., Moody's Analytics.
(SPEECH)
For one, the labor market is quite weak. Now, we had a big-- seemingly had a big turnaround in the spring of this year. Just to give you some context, in 2005, we only added about 150,000 jobs on net for the entire year. That's the worst showing in the job market that we've had outside of a recession since about 2003. The unemployment rate, however, didn't really move that much. It moved up only two-tenths of a percentage point, and that is because the labor force has essentially stopped growing. Again, this goes back to immigration policy.
So we are now seeing labor force growth on a year-over-year basis that's barely positive. And so we have this contraction in labor supply, but we also have employers demanding less labor, so business conditions have softened. There's a lot more uncertainty out there in the economy, and we've seen the hiring rate done by companies drop to a 15-year low.
At the same time, we're not seeing a huge pickup in layoffs, which is the good news so far. There's been some high-profile announced layoffs in the tech sector, of course, and a lot of that gets attributed to AI. But economy-wide, we're not seeing a big pickup in layoffs. What this means is if you have a job, you're probably OK. If you lose a job and you start looking for a new one, or if you're just entering the job market for the first time, like if you're a new grad, it's become increasingly difficult to find a job. So we have a weakening job market, which is the No. 1 predictor of how people's economic fortunes will play out over the course of the next few years.
And at the same time, since the war with Iran started in February, we've seen inflation pick up quite a bit.
(DESCRIPTION)
Higher Energy Costs Due to the Iran War Swamp the Tax Cuts. Cumulative increase in tax refunds in 2026 over 2025 versus additional energy spending due to the Iran war, in billions of dollars. A graph lists months from February to June on the X-axis, and billion-dollar values from minus 80 to plus 60 on the Y-axis. A green curve labeled energy spending descends from zero in February, and gradually curves down toward minus 72 in mid-June. A blue line labeled income tax refunds starts at zero in February, then zigzags, generally trending upward to 55 in mid-June. A red line labeled net copies the zigzag, upward trending shape of the income tax refunds through March, then begins to lower in April. In May, it dips below zero and by mid-June, it dips past minus 20. Text, As of June 17, Bigger tax refunds, $55.3 billion. Extra energy spending, $72.2 billion. Difference, minus $16.9 billion. Sources, US Treasury, American Automobile Association, E.I.A., Moody's Analytics.
(SPEECH)
So we've seen inflation go from right above like 2% to much closer to 3% on a year-over-year basis. So now inflation is swamping any wage gains that most people are getting.
We got an inflation report yesterday. It was better than expected, but I don't think that this lasts because again, coming back to the war, it seems based on even just this morning's headlines that we are back to full, all-out conflict with Iran. So the ceasefire is over. The Strait of Hormuz is closed again. And what's really concerning about that is that we are running out of oil inventories.
So if we look at the inventories of oil that we have in the Strategic Petroleum Reserve, they are lower than they've been since 1983. We have probably about 100 days left in that Strategic Petroleum Reserve. If this-- The longer this goes on, the greater the risk that this actually causes major economic damage, perhaps in the form of recession, and we see oil prices spike well above $100 a barrel.
Putting this all together, if we look at the cost of the war, which we estimate to have been about $1,000 per household so far since it started, we see that it is now swamping the effect of the increase in tax refunds that I mentioned earlier. So now on a per household basis, probably looking at about $17 billion total is the difference in energy cost that we've spent. And this is the result of a few things.
So we know oil prices have gone higher since the Strait is closed. This means higher gas prices. It means higher diesel prices. And this is also now leaking into things like food prices. Again, going back to that K, lower-income, middle-income households spend much more of their monthly income on food. So we're looking at something like $400 more was the average tax refund that people got this year, about $400 more than they got last year. But as I said, households have spent roughly about $1,000 more due to these higher energy costs.
And you see it when you look at the income and the savings numbers.
(DESCRIPTION)
Consumers are Under Significant Financial Stress. 3-month moving average. A graph measures months from January 2025 to May 2026 on the X-axis. The left edge measures real after-tax income growth, percent change year ago, ranging from minus 0.5 to positive 2.5. The right edge measures personal saving rate percentage, ranging from 3.0 to 5.5. Blue bars measure the income growth by month, starting at 2.2 in January of '25. The percentage hovers between 1.9 and 2.3 through April of '25, then dips to 1.45 in July. The number briefly crests upward, then gradually sinks to minus 0.4 in June of '26. A green line representing personal saving rate roughly follows the shape of the bar graph. It peaks at 5.2 in April of 25, then sinks down to 3.8 in December of 2025. It briefly rallies, then drops to 3.2 in June of '26. Text, Sources, B.E.A., Moody's Analytics.
(SPEECH)
So if we look at real disposable income, this is the blue bars plotted on the left-hand side here, and we look at the personal savings rate, that's the green line plotted on the right. We see real after-tax income. This is adjusting for inflation. This is now falling. After yesterday's report on CPI, which is a little better, this might look a little better, that final bar, but it's still probably around zero, I would imagine.
The savings rate is approaching 3%. This is the lowest savings rate that we've had in decades, if you strip out the pandemic, let's say. It's the lowest savings rate we've had outside of a recession. So this suggests that households are tapping their savings to afford monthly bills.
So again, this is-- why, Jessica, you asked, why is there this disparity between what's going on in the stock market and what's going on in the bond market and what's going on amongst consumer confidence? I think because the vast majority of households are facing-- starting to face real financial strain from this. That's very negative, and I don't want to end on a completely negative note.
I will say, just to reiterate that our assumption is that it really hinges, I think, now, on the outcome of the war. If this is resolved-- and by resolved, I don't expect it to be completely resolved. But if we can get the Strait of Hormuz open and oil flowing again within the next couple of months, let's say by Labor Day, ideally, then I think we escape the year without a recession, and we can stick to that 2% growth forecast. If this goes on longer, then it really starts to bleed into other parts of the economy and supply chains, and then there's much more room to worry about recession.
And if we think about all the things we worry about, this is just a didactic tool I like to look at, just to see how are we thinking about the risks that are out there.
(DESCRIPTION)
U.S. Risk Matrix, July 2026. What We're Watching.
(SPEECH)
So the x-axis is the economic severity of the risk. We don't put any numbers to this. Again, this is just subjective. So you can think of this as the net present value of what the impact on GDP growth would be. And then on the y-axis, it's the likelihood of the risk happening.
(DESCRIPTION)
Many labeled bullet points appear within the graph. While most bullet points are black, a few in red represent increased severity and or probability of risk. A few green bullets represent decreased severity and or probability of risk.
(SPEECH)
So the stuff that's in the northeast corner of this chart, where I have some things highlighted, are the things where we think it's likely-- more likely to happen. And if it does happen, it will have a greater risk to the overall economy.
(DESCRIPTION)
Red items include AI stock sell-off, global trade war intensifies, and institutional erosion. Green items include Iran war intensifies, US dollar slides, and Fed dependence is impaired.
(SPEECH)
So some of the things that we've moved higher in the past few months are the global trade war intensifying. We have that up there because the administration has now called into question the renegotiation of the USMCA. This is the trade act that replaced NAFTA when President Trump came into office. And this would negotiate trade between Mexico and China. Mexico is now our biggest trading partner, so this is really key. And the administration is saying they may not renew this. So that's kind of heightened some of this trade war concern for us.
And then I would point to one other one, which is the AI stock sell-off. If you look at the value of some of these stocks, they certainly look frothy. They look like they could be overvalued. And here I'm talking probably something akin to what we saw in the dot-com bust back in 2001. So a sell-off on the magnitude of 15% to 20% in the stock market would have really drastic consequences for the economy because of what I was just talking about in terms of the wealth effect and how that's powered consumer spending.
We had put the Iran war intensifying. We had decreased the severity of that. We did this last week. I wouldn't have this in green as a decreased risk anymore, just as of today.
Fed independence, I didn't talk much about the Fed. Maybe Jessica and I will get into that a little bit, but there was a Supreme Court ruling that essentially protected Federal Reserve officials from presidential firings. So we've lowered that down as a risk here.
(DESCRIPTION)
The following bullet points appear within the graph. Precious metal prices plummet, economy skews more K-shaped, Federal Reserve missteps, crypto market crash, subprime borrowers pull back, U.S.-China tensions increase, private credit craters, major cyber attack, banking system seizes up, sovereign debt crisis, non-bank mortgage companies falter, insurance markets break down, climate change, supply-chain disruptions, C.R.E. prices slide, House prices slump, terrorist event, Russia-Ukraine war escalates, global pandemic, mass immigrant deportation, AI leads to large job loss, bond market meltdown.
(SPEECH)
But these are some of the things that-- we put this chart together every month, and it helps us as economists to think about what's out there, what are the tail events which we should be thinking about, and what should we be watching when we're thinking about the prospects of the economy.
So with that, Jessica, I will stop talking. Oh, here's just another little plug for the podcast.
(DESCRIPTION)
Text, Moody's Talks, Inside Economics, Perspectives on the evolving economic landscape. Thank you. Please attribute information in this document to Moody's Analytics, which is a division within Moody's that is separate from Moody's Ratings. Accordingly, the viewpoints expressed herein do not reflect those of Moody's Ratings. Contact Us, Email, help [email protected]. U.S. slash Canada, 1.866.275.3266. E.M.E.A., 44.20.7772.5454, London. 420.234.747.505, Prague. Asia slash Pacific, 852.3551.3077. All others, 1.610.235.5299. www.economy.com.
(SPEECH)
We do this. We release this every Friday. It's just a very casual conversation about economics between me and my boss, Mark Zandi, who's the Chief Economist, and our Deputy Chief Economist. So please listen in, if you can.
(DESCRIPTION)
Jessica Kearney.
(SPEECH)
JESSICA KEARNEY: Awesome, thanks. Thank you. Marisa. That was a terrific overview, a great way to get the conversation started. I know, really appreciate your thoughts. As we teed this up in the marketing description on the K-shaped economy, particularly drilling down on, as you said, consumer spending, consumer confidence, all of that being such a large factor of the economy and the GDP and even the low savings rate, lowest, you said, outside of a recessionary period. So that's all very interesting and an important thread in the story.
Just to kick us off here, going to inflation. So you mentioned that we got some data out yesterday that was slightly better than expected. Can you spend a minute more talking on that? Because I think all of us remember very well the COVID era or right after COVID era inflation and how long it took us to come back down. Can you compare that and the length of time on the tailwind? I know you mentioned so much of that is tied up in some of the potentially geopolitics that's happening right now, but can you-- for all of us that have that 9% inflation burned into our memory from 2022, can you compare that to where we are now?
(DESCRIPTION)
Marisa DiNatale.
(SPEECH)
MARISA DINATALE: Yeah, it's a good question and one I've been thinking about more as this war drags on. When does this-- when is the point where this becomes entrenched, which is what happened coming out of the pandemic?
It's a little different. So back then, when really the catalyst for that-- well, there were two things going on, again, at the same time back then. One is that we had this global reopening of the economy in 2021, right? So we were kind of all shut down through 2020. Everybody was in their houses ordering Amazon packages, and then we got this vaccine rollout in 2021 and things started to reopen. So we had this surge of demand at the same time that we were still grappling with supply shortages from the pandemic.
For example, if you recall, we still had a lot of Chinese ports were shut down, and they were not shipping things out of China, if you remember the chips shortage back then. So people couldn't buy cars. The price of anything with a chip in it, a computer, a cell phone was still being impacted. So we had a lot of supply chain things going on at the same time that we had this massive surge in demand as people re-emerged after COVID.
Then in early 2022, Russia invaded Ukraine, and there were so many more supply chain impacts to that than I think a lot of people knew. So things like xenon and neon and sunflower oil, all of a sudden, all these commodities that went through that part of the world were in very short supply. So it was another supply chain crunch. What we're seeing right now-- and to be fair, a lot of economists were saying, oh, this is going to be temporary. This is going to be transitory. And it went on and on and on because it was much more entrenched than I think a lot of people realized.
Typically with an oil price shock, which is what we're seeing now with the war, that tends to be a lot more flexible and can bounce back quicker. The risk here is that this does start to have more supply chain issues. So we're not talking about a global oil supply shock here. We're talking about 20% of the world's oil exports coming out of this part of the world. So there's other oil out there that can be tapped. This is a big constraint on oil, but it's not everything.
And we do have-- there are some other products that go through the Strait of Hormuz, but it's not as pervasive as what we saw during COVID, where you had China, the biggest exporter in the world, being hampered, and then you had the Russia-Ukraine thing. So we think it's a lot more likely to be able to come back quickly.
And that's kind of what we saw yesterday, right? So when we had this ceasefire signed a few weeks ago and gas prices and oil prices came down quite a lot, that's the impetus for why the CPI fell yesterday. I'm expecting that's probably going to reverse when we look at the numbers next month. But that just shows you that it is kind of different, that an oil price shock tends to be a lot more shorter-lived than a more pervasive supply chain shock.
JESSICA KEARNEY: That's really helpful, the lens through which to view it and to be tracking the headlines as we move forward in the months ahead.
You just mentioned the CPI. So core CPI is running at 2.6%, so still above the Fed's 2% goal. Do you see a path back to target and on what timeline?
MARISA DINATALE: So yes. So we are forecasting that we get back down to around 2% inflation by 2028, so probably a couple of years. The Fed is very focused on inflation now, right? They have a dual mandate to balance full employment with a 2% inflation target. And I should say the 2% inflation target is not on the CPI. It's on the PCE deflator, which is also well above 2%. I mean, any inflation measure right now is above the Fed's target, so the Fed is very focused on that.
So there's much more likely to be another rate increase this year than there is a cutting of rates. That's almost totally off the table, I think, as we sit here. And I think they will do that if they see the need to do that. And again, the longer inflation stays above target and the longer it's moving upward away from the target, I think that becomes more likely.
So we have penciled in a Fed rate hike for this year, later in the year. Most markets are penciling in two rate hikes this year. We're still at one. And so we're looking at-- this isn't good news, right, for most businesses and consumers. But the Fed is focused on getting inflation down and keeping it from becoming pernicious. And I think if we can do that, and I think if we can wrap up the war situation, at least in the sense that we can get oil flowing again normally, I think we could get back down to 2% by 2028.
JESSICA KEARNEY: Great, great. No, that's helpful and helpful to hear how you're thinking about the potential for the rate increases, as well.
You mentioned the labor market, so I want to talk about jobs a bit. And I know you had a whole chart on this. Where is job growth slowing, and where is it holding up? Are there different pockets within those overall numbers that you could speak to?
MARISA DINATALE: Yeah, absolutely. So job growth as a whole is about-- running at about 100,000 a month on the payroll survey. The household survey is telling us a completely opposite, different story, but that's probably for another day. So we actually think that underlying job growth is probably closer to 70,000 or 80,000 a month.
What's concerning about the job market, to your question, is that almost 90% of the jobs that we've added in the past year have come from basically one industry, and that is healthcare. So outside of healthcare, there's been almost zero job growth. If you look at it, smooth out the month-to-month volatility, and you look at it year over year.
So the other industries that we have seen some job growth in this year are leisure, hospitality and retail. There is some speculation that some of that growth could have been juiced up by preparations for the World Cup in the past couple months. We saw that in May, I think, which means that it's temporary, right? So those jobs will disappear once the World Cup is over next week, I guess.
So yeah, it is pretty weak. Outside of healthcare, we don't see a lot of growth. In fact, you see outright declines in industries like manufacturing, financial services, professional services. And the worry there is that the industries that are declining tend to be the higher-paying industries. The industries that are actually adding jobs tend to be the lower-paying industries, and this is why we've seen nominal wage growth slow, as well.
JESSICA KEARNEY: Yeah, that makes sense. You talked also a little bit about demographics. And I wanted to circle back to that comment. So we actually, we just had a webinar on this a few weeks ago on in terms of workforce demographics, the shrinking labor supply and some of the long-term pressures on the labor market. And we're actually getting a question in from someone in the audience now from Ali, saying, as 40% to 45% of boomers have not yet but will soon retire, what's your perspective on the outlook of its interplay with the economy and the transfer of wealth and estates?
MARISA DINATALE: Yeah, it's a huge demographic shift that is underway and has been underway. The boomers are an enormous population group. If I just look at the number of people that are in their 60s, they make up 10% of the current labor force. So that means you're looking at 10% of the labor force is either at or near retirement age, and likely will be retiring within the next 10 years.
We do have big demographic groups behind them. Specifically, the millennials and Gen Z are big. They're actually bigger than the boomers. So there are workers behind them, but with retirement of a lot of the baby boomers goes a lot of knowledge. So a lot of these people have been with their companies or in their industries for a very long time. And the feeling is you may be able to replace them with younger workers, but there might not be as much productivity, initially, when you replace them with younger workers.
But yeah, if you just look at the aging of the population and nothing else, it would suggest that the labor force is going to be in outright decline by 2050. So take away anything cyclical going on, take away anything economic happening. If you just look at the demographics, we'll be in outright decline by 2050.
And this also assumes that current immigration policy stays in place. So typically, you have immigrants replacing and immigrants tend to be younger, and they tend to be in their prime working years. So you have them being able to replace a lot of the people that are retiring. That has been very, as we all know, very much curtailed. So you don't have that as a replacement factor.
So that means lower potential growth for the economy, No. 1. And then I think the second part of her question was about the wealth transfer that could happen.
I've read a lot about this, and it's a great question and I get it all the time. It's tricky, because this is happening over a very slow and drawn-out time horizon. It's been going on. It will continue to go on for decades. So I don't think it's going to be an event where we see this sort of shock to the economy, or we see this massive transfer of wealth happen in one year or two. It's been going on for a long time.
The other trend that we're seeing that sort of hampers some of this, is that a lot of these people, a lot of older people are staying put. They're not moving out of their homes. If you look at-- I've seen some statistics on the number of single or couple people that are living in homes that are more than 3,000 square feet, It's at an all-time high. So there's not as much real estate transfer happening as we would expect. It will, of course, inevitably happen someday, but it hasn't been happening as quickly as we might expect.
But yeah, it's a great question. I would just say I don't think it's an economic shock or event. I think it's kind of an iceberg moving through time over the next few decades.
JESSICA KEARNEY: We're getting additional audience questions on this. We have a question coming in. How have the declining birth rates impact, or how will they impact the overall economy? And of course, when we think about the boomers retiring, the birth rate declining, but also some boost, maybe, in productivity, as well, in the labor market, and we start to think about impacts on government expenditures like Social Security and those types of things that factor in, as well. So lots to-- lots to think about there.
MARISA DINATALE: Yeah, I mean, the natural increase in the population, so if you just look at births minus deaths, that is not going to be enough to keep the population growing at all. So you need some immigration to keep it growing or you will have-- we will see population decline in this country if that continues, kind of like what Japan had experienced, right, which was decades of slow growth and a declining population, because you had a very old population that was aging very quickly and people just weren't having babies. And they were very restrictive with immigration, too. Really didn't let a lot of immigrants in.
So you had a very kind of pernicious slow decline, deflation, low GDP growth. That could be-- we're not there. We're not on that magnitude at all. But that is kind of what we're looking at, just broadly speaking, with the natural increase in our rate of population.
JESSICA KEARNEY: So I want to put a pin in that because I want to circle back to it. I want to talk a little bit about interest rates and the bond market, and then eventually get to a little bit on the national debt, as well. So talking about why do elevated Treasury and bond rates matter so much for consumers, businesses and the broader economy, so let's start there.
MARISA DINATALE: OK. Yeah. So most interest rates that people pay, whether it's a mortgage rate or it's a credit card rate, are benchmarked to a Treasury yield. So it could be a short-term Treasury yield. It could be a long-term Treasury yield. For example, a 30-year fixed mortgage rate is benchmarked to the 10-year Treasury yield. So as interest rates rise on Treasury debt, then all, generally speaking, all interest rates that people pay across the economy, whether they're a government or whether they're a consumer, are going up.
And we've seen that, right? We've seen that play out just over the past few years as the Fed has raised rates. As the-- You mentioned the fiscal health of this country has become more concerning. We've seen bond yields rise and we've seen mortgage rates rise. I mean, we went from mortgage rates that were around 3% in 2021 to closer to 6% today, so almost doubled.
And that makes things extremely unaffordable. I mean even if-- we've seen massive house price appreciation, too. But I mean, we would need-- we would basically need interest rates to fall to near zero right now on a 30-year mortgage to get back to the affordability we were at five years ago. And that's not going to happen. So it has real impacts for consumers.
Did I answer the full question there?
JESSICA KEARNEY: Yes.
MARISA DINATALE: OK.
JESSICA KEARNEY: Yeah. And so what do you think the bond market is signaling right now?
MARISA DINATALE: So there are expectations around inflation, right? So there are expectations that inflation has notched higher, and investors need a higher return on their investment because inflation is eroding some of it. I think there is concern about the trajectory of the debt to GDP ratio in this country. It will at some point become unsustainable. We've recently passed the 100% threshold. The debt to GDP ratio passed that 100% threshold very recently, like in the past couple of months.
That in and of itself is not a problem necessarily, but I think psychologically to bond investors, it doesn't sound good. And the trajectory is up. So at the same time, we've cut taxes. We're taking in less revenue. The job market has slowed, so we're taking in less income tax revenue. And now we're paying for a war. So all of this adds up to a worsening of the fiscal situation.
And I honestly don't think that there's any political appetite to do anything about it. I don't think there will be until there's some sort of crisis, until the U.S. is about to default on some of its debt, or you see foreign investors pulling out of U.S. Treasury securities. It is-- It's not sustainable, but I don't see-- I don't really see any impetus to-- for anybody to deal with it until they are forced to deal with it.
JESSICA KEARNEY: That was going to be my next question.
MARISA DINATALE: Which is not great.
JESSICA KEARNEY: Yeah, you mentioned national debt being 100% of GDP, now over $39 trillion. I was going to ask you, what do you think the tipping point should be, but I think you answered it square on the head. And something that we certainly all need to keep our eyes on.
MARISA DINATALE: Yeah. I mean, we're spending-- now we are spending more on-- our government is spending more on interest payments on that debt than we were on national defense before the war. I mean, that's pretty stark, when you think about it in those terms. That interest on the debt is such a huge piece of the pie now.
JESSICA KEARNEY: Right. I wanted to circle back. So on your podcast, you play a trivia game. It's called the Stats Game. And for any fans of your podcast who've listened in, you'll probably be familiar with this. Do you want to tee up what you do on the podcast? And we were going to do it here for our audience and get them engaged a bit in the conversation.
MARISA DINATALE: Yeah, sure. I hope people enjoy this. This is meant to be fun.
So every week on the podcast, me and my two co-hosts try to stump one another with a statistic, and it's usually a statistic that either is recently released, had come out over the past couple weeks, or it's a statistic where we want to use it to make a point about something. So it might spark a discussion about something. So we give the statistic and then the other guests or co-hosts try to guess what that statistic is.
JESSICA KEARNEY: All right. Perfect. So we are going to throw up a polling question on screen, so audience members, give this a read and give it your best guess. So Marisa, you say your number is 2%. So we want audience members to, out of the three options, guess at what this 2% equates to.
All right. And the options are the share of businesses that say AI has reduced their headcount in the last six months. And that's trending at about a quarter of respondents picking that one. The unemployment rate of college graduates. You spoke to a little bit to some of those trends earlier. And the last answer is the five-year-ahead expectation for annual inflation, which was the most popular answer at 68%. Marisa, do you want to do the big reveal?
MARISA DINATALE: Sure. And you might get mad at me when I tell you this, but you'd all be close no matter what you picked. So these are all 2 point something percent, OK? So I made it very probably unfairly hard. But the 2% on the dot, 2.0%, is the first one. It's the share of businesses that say that AI has led to employment declines in their business over the last six months.
The unemployment rate of college grads is like 2.5%, and the five-year-ahead expectation for annual inflation is about 2.6%, 2.7% right now. So they're all 2-something, so I could give everybody credit for that. But the one I was thinking about right on the nose is the first one. It's the AI impact on employment.
JESSICA KEARNEY: Do you want to say any more about that? I think with a lot of the headlines, I think maybe some people would have assumed it was a different number. But is anything to dig in there a little bit further?
MARISA DINATALE: You mean on the AI question? Yeah. So yeah, I mean, it's very interesting. And obviously, everybody is very focused on AI's impact on the economy broadly. I'm very focused of its impact on the labor market because I'm a labor economist.
We are-- it's interesting. There's two things. Well, there's a lot of things going on. One, I've already talked about the impact of AI broadly on the economy through all the spending by the AI companies. It's really juicing capital spending. We're seeing this massive investment in building out of data centers. So that's helping the economy.
What's less clear is what it's doing to productivity growth. There's people that say we have higher productivity growth today because of AI. I don't personally believe that. I think it's too early to see a positive impact of productivity from AI. But what-- and on the other side of that coin is that it's really also been really hard to tease out what the impact of AI is on the job market currently. But we do have some surveys that directly ask this, and that was what the first statistic was.
So this is a Census Bureau survey that's done every couple weeks, and they ask businesses across all industries if they're using AI, how they're using AI, what are they doing with AI, etc., etc. And one of the questions they ask is, how has it affected the level of employment at your company?
And as of the latest read, only 2% say that it's actually led to a reduction in employment. Interestingly enough, more like 3% say that it's led to an increase in employment at their company. And this is true across every single industry. Even the tech industry, where we keep hearing that AI is the cause of big layoffs, it actually seems to be adding more jobs right now than it is subtracting jobs.
Now, that may change in the future. I think it's anybody's guess how this all plays out, but I have become increasingly more sanguine about the fact that I think AI will, for most people, be more complementary to their job rather than a replacement of the job. So I'm thinking of it more like the way we saw the implementation of the internet or the personal computer or smartphones. Those things did eliminate some jobs, but they also created a lot of jobs, and I think AI will do the same. I think it will create a lot of jobs that we can't even conceive of right now.
I mean, at least that's my hope. But I don't stand firmly on that ground because I think it's evolving so quickly, and it's kind of anybody's guess how it's going to play out.
JESSICA KEARNEY: No, I appreciate that. I thank you for your thoughts on that. We've been getting a lot of audience questions on that very topic, so I think that answered a bunch of questions all at once.
I want to transition to trade policy. I was curious if you could give an update on trade and how that's factoring into Moody's forecasts and your outlook.
MARISA DINATALE: Yeah, so I think-- so when President Trump came into office in early 2025, obviously, he enacted very broad-based tariffs on almost every country in the world, almost all of our trading partners. It was kind of a mishmash. I mean, there were a lot of exceptions to that. There were differing trade rates. And then, of course, the courts came in and struck a lot of that down. But then the administration turned around and said, OK, we'll use a different statute to implement tariffs again.
So right now, we think the effective tariff rate is about 8%. For some context, before he came into office, the effective tariff rate was more like 2% to 3%. So it's a quadrupling in the tariff rate.
Most of the impact, or at least I should say the negative impact of that, I think is behind us. I mean, there is still an impact going on. It still has raised the price of a lot of goods that we're importing. But I think the shock of that really was last year, so it took more out of growth in 2025 than it has this year and that it will do next year.
So there's still uncertainty. I think I mentioned in my comments earlier the USMCA, which is the replacement to NAFTA that was supposed to be renegotiated this year. He's cast some doubt on whether or not he wants to do that. So that raises more uncertainty around the tariff thing. But I think most companies have actually been able to navigate through this by absorbing a lot of those costs themselves, rather than passing them on to consumers.
There are very real things we can look at. If you look at the CPI and you look at tariff-sensitive goods, you can certainly see that prices for those have grown faster than they have for non-tariff-sensitive goods. But I think the impact of it was probably less than a lot of people thought it would be. And I think it's because a lot of businesses absorbed those costs themselves. And in some cases, the exporter, the exporting country may have absorbed some of those costs themselves. At least that's what we've heard from a lot of our clients and people that are in the import-export trade business.
So it's still a negative for the economy, but I think it's not as big of a negative as it was last year. And that will continue to wane as we go forward. And then of course, we're going to have a change in Congress. We're going to have a change in president eventually. It's unlikely that this level, I think, of tariffs stays in place through, let's say, the next administration. I think there'll be some relief on that front.
JESSICA KEARNEY: And you mentioned, we obviously have the midterm elections here in the U.S. coming up in November. Anything that you and your team will be watching, in particular in terms of the economy as a result of the midterms?
MARISA DINATALE: I mean, I think it's interesting to see if there is a hastening of perhaps of trying to end the Iran war before the midterms come into effect. We really thought that would be an impetus to pull back, to really stick to a ceasefire, to try to get this wrapped up.
People often hear the cliche that people vote with their pocketbooks. So people drive by a gas station every day. People have to fill up their gas tanks on a weekly basis, sometimes more. And they can see what's going on with gas prices. And back to the consumer confidence, I mean, that very strongly impacts people's views of the economy. So I would think it's in President Trump's best interest to try to get inflation under control. And the easiest way to do that is to not have these hostilities with Iran going on for long.
So it could influence the midterms, I think, kind of regardless of what happens with the war. I mean, we're likely to see a divided Congress, which means probably a more divided Congress than we have now, likely. We might have a split Congress, which would make it harder for things to do, harder for bills to get passed, although a lot of stuff has been done by executive order anyway and has completely bypassed Congress. So regardless of the outcome, I'm not expecting huge changes in policy for the next couple of years.
JESSICA KEARNEY: Thank you. That's helpful. I know it's a lifetime between now and then. Lots could happen, but it's helpful to see your perspective on that.
We're almost at the top of the hour, but I want to get in a few more audience questions. We've got questions coming in from Joanne and Shauna, who are both asking about the outlook for the housing market. I know you touched on this a little bit during your presentation. Generally, the outlook for the housing market and more specifically, residential construction and whether there's likely to be an upside or downside for the forecast, based on where that's heading.
MARISA DINATALE: So the housing market is kind of-- the housing market is, I mean, I would almost characterize it as being in a recession for the past few years. As interest rates have risen, there's really been kind of a standstill on homebuying. Affordability is at an all-time low so it's very, very difficult, particularly for first-time homebuyers, to get in the door. I don't see that changing, unfortunately, anytime soon.
A housing bill was just passed. The road-- I forget what it was called, but they just passed a big housing bill. It has some provisions in it that aim to increase the supply of housing, which is encouraging because I think a lot of housing policy that we've seen over the past few years has made it-- has tried to make it more affordable. But in doing that, you're juicing up the demand side of the ledger while ignoring the supply side. And the real problem with the housing market now is that there is not enough supply.
I mean, we're estimating there's a deficit of about two million homes, and so it's going to take a while to get that deficit filled. And I don't think this bill really does that. I mean, I think it could do it on the margins in some places. I think a lot of the problem with the housing market is more local. I don't think there's a ton that the federal government can do, because a lot of it is local ordinances and zoning and land use, and that sort of thing. And that's stuff that localities have to tackle on their own.
Now, back to the baby boomers. In theory, we should see a lot of housing supply come on the market, perhaps, or at least change hands, and perhaps help with absorption. So that's a positive, I think. The demographics might be a positive for the housing market. But even rents are-- I think I was reading something the other day that someone I follow on LinkedIn, who's in the apartment market, was saying that rents are in outright decline now. That makes renting more affordable, but it is not an incentive for builders to put new apartments or units in the ground.
I guess the short answer to her question is that the outlook is kind of more of the same, very weak appreciation. I mean, we're seeing appreciation that's in the 1% to 2% per year nationally bucket for single-family existing homes, rent softening. We've had a lot of supply of multifamily come on the market in the past couple of years. That's helped some relief on the rent side. But on the ownership side, I don't see much relief happening unless local governments really change housing policy and make it more affordable for builders to get in and build more affordable housing.
The other problem is a lot of the housing that has been put in place are not starter homes. They're not homes that a brand-new, first-time buyer are going to buy. And again, I think this is where local governments have to step up and really think about their housing policy.
JESSICA KEARNEY: That's helpful. And thank you for answering that. We're at the top of the hour, but I'm not going to leave the audience on a glum note here on the housing. I'm wondering if you have any final thoughts for our audience as we wrap up, or maybe even any bright spots in the economy as we're looking ahead into 2027.
MARISA DINATALE: Yeah, I mean, I see some bright spots. I think there's some-- not to go back to AI, but I think this could be actually beneficial to a lot of people in their jobs. I think it has the potential, and I think it certainly will transform productivity growth. I don't think that's what's going on right now. But if I look five years ahead, I think we have the potential for a much faster growing economy and a much more productive economy.
This might cause transition, likely will cause transition pain for some segments of the labor market, and I think we have to figure out how we educate people toward the new jobs that may be created. But I do see it as a bright spot. And I will say, when you look around the world, the U.S. has cornered the market on this in terms of building out the infrastructure.
Now, we've heard a lot about Chinese AI models and Chinese technology starting to catch up or even lap U.S. technology. That's certainly a concern. But right now, when you look across the whole world and you look at where the infrastructure is, where the data centers are, the US is the hub of that, and most of the big companies are headquartered here. So if we can keep our hold on that, I think that positions us well in the global economy for the years to come.
I would also say that I think coming out of the pandemic, the labor market has become much more flexible. So people are probably likely more able to find jobs that better suit them. This goes back to remote work, hybrid work, new ways of working. Just the fact that we're doing this over Zoom right now is very different, how we may have done this five or 10 years ago. I think those things make it easier to work and easier to balance work with the rest of your life if you're lucky enough to work for a company that lets you do that.
And though we've heard a lot of stories about back to the office, and that's certainly a trend that has happened, if you look at the statistics on this, it's really leveled off. We don't see much more of a movement on the hybrid remote thing going on. So it seems like where we are right now is where we're likely to be in the next five years, and I view that as a good thing.
JESSICA KEARNEY: That's great. That's great. Well, we'll leave it there. Marisa, we are so appreciative for your time. I hope everyone checks out the podcast, Inside Economics, weekly podcast. We know you guys are very busy over there doing some great work at Moody's Analytics, so we appreciate your time with us. This has been a great hour, helping our audience connect all the dots and connect all the headlines that we read on a day-to-day basis. So thank you, Marisa, for your time. It's been great.
MARISA DINATALE: Thanks for having me. Appreciate it.
JESSICA KEARNEY: Thank you.
All right. Great. Well, thanks to you all for joining us and sticking around for the hour, as well. As always, we are dropping a survey about today's program in the chat, so please take a look at that and let us know what you thought about today's session.
(DESCRIPTION)
Text, Wednesdays with Woodward (registered trademark) Webinar Series. Take our Survey, Link in Chat. Logos, Travelers Institute (registered trademark,) Travelers.
(SPEECH)
And as always, you can check out our webinar replays, too, anything we've hosted this year on our website, travelersinstitute.org.
(DESCRIPTION)
Text, Watch TravelersInstitute.org. Linked In, Connect, Joan Kois Woodward. Travelers Institute Risk and Resilience. Listen wherever you get your pods.
(SPEECH)
You can also bring us for your summer listening on the go. We have our Travelers Institute Risk and Resilience podcast, so check it out and bring some of our latest webinar replays with you on your travels this summer. And with that, we're taking a break in programming until the fall. So we will be right back in September with a great lineup of programs for you. I hope you have a restful summer, and we will look forward to seeing you in September. Thanks for being with us today.
[AUDIO LOGO]
(DESCRIPTION)
Logos, Travelers Institute (registered trademark,) Travelers. TravelersInstitute.org.
Please note: Due to the nature of the replays, survey and chat features mentioned in webinar recordings are no longer active.
JOAN WOODWARD: Hi, folks, and welcome back to the Travelers Institute Risk and Resilience podcast. I'm your host, Joan Woodward, President of the Travelers Institute. Right now, the U.S. economy is telling two very different stories. Consumer sentiment is at an all-time low, while the stock market is near an all-time high. To unpack those conflicting stories, Jessica Kearney at the Travelers Institute was recently joined by Marisa DiNatale, Senior Director and Global Head of Forecasting at Moody's Analytics, for a deep dive on the economy and her outlook for the year ahead. Marisa explored why geopolitical conflicts are offsetting fiscal policy tailwinds, and how AI's momentum continues to stimulate the economy despite slower job growth and elevated inflation. Take a listen to their conversation.
JESSICA KEARNEY: All right. So we're going to jump right in because we have a lot to cover today. If you've been following the economy at all over the past few months, you've likely noticed some contrasting headlines. Consumer sentiment is near an all-time low, but the stock market is near an all-time high. Geopolitical conflict and trade tensions threaten growth, but momentum and investment in AI have given the economy a boost. And we've seen an uptick in inflation but softer job growth. So help us unpack all these moving parts. I am so thrilled to be joined by Marisa DiNatale, who is the Senior Director and Global Head of Forecasting at Moody's Analytics, where she oversees macroeconomic forecasting and publication operations in the economics group. Her areas of specialization and research include U.S. labor markets, household balance sheets and credit, as well as international economics. She's also the co-host of the weekly Inside Economics podcast – definitely check that out if you're not already a listener – with Moody's Chief Economist Mark Zandi, who has joined us as well over the past year. So to kick things off today, Marisa is going to give us an overview of the current state of the economy. And then I'm going to join her for a moderated discussion and your questions. Marisa, welcome. Thank you so much for your time. I'm going to turn the floor over to you for our economic outlook.
MARISA DINATALE: Thanks, Jessica. It's really nice to be here – thanks for having me, and thank you to everyone who's joining. Looking forward to answering your questions. I'm going to take about 25 minutes and give you a high-level view of our current forecast for 2026 and 2027. We update our baseline forecast – and about nine alternative scenarios around that baseline – every single month. In the past week or so, we've just completed our forecast for July. I will say forecasting in this environment is quite difficult because things seem to be changing very rapidly with all of the policy changes and with the conflict with Iran, which seems to be on and off depending on the day. But I'm going to talk through how we're thinking about the current economic environment, the things we're watching and the things we think you should be watching too. So the economy is actually performing pretty well – probably better than a lot of people expected given some of the headwinds we've faced. Some of this is fortuitous timing, because at the same time that we've had headwinds slowing growth, we've also had some beneficial tailwinds happening simultaneously that have helped offset some of those dampeners. The economy grew about 2% in 2025. Our forecast is that it continues to grow just about 2% in 2026 and 2027. We expect growth to slow somewhat as we go through the rest of this summer, and hopefully, with an end to tensions with Iran in the next few months, we'll start to see some relief – not only for growth but for inflation. Two percent growth is OK. It is, however, probably below the economy's rate of potential growth, which we think is about two and a half percent. If it were not for the Iran war, we'd probably be right around that two and a half percent right now. We are seeing a declining labor force because of immigration policy as well as the aging baby boom generation, which is now in prime retirement years – that's taking some juice out of the economy and limiting how fast it can grow. The good story here is that AI is doing a lot of the heavy lifting. Tariffs and trade restrictions are taking about 0.6 percentage points off of growth. Immigration policy – because it has essentially brought labor force growth to a standstill – is probably taking another 0.4 percentage points off. AI has come along and is juicing up capital investment by companies, construction of data centers and – perhaps most importantly – supporting household spending through the wealth effect. AI is really helping to offset some of these negative trends. Additionally, the One Big Beautiful Bill Act was passed last summer and many of those tax provisions went into effect starting this year. As a result, households saw bigger tax returns on average when they filed this year than last year – another benefit to growth. I will also say that the model we run to predict the probability of recession over the next year is telling us that probability is about 30% right now. In normal times, that baseline probability is about 15%. So by comparison, 30% is quite high. The growth is real, but I think it's tenuous, and I'm going to go through some of the reasons why.
MARISA DINATALE: Jessica mentioned at the outset the disparity between very bad consumer confidence and a stock market that's going gangbusters. Consumer confidence surveys – from both the Conference Board and the University of Michigan – are showing results that are even more negative than they were in the first few months of the pandemic, right when the economy was completely shut down. People right now are saying they feel even worse than they did back then. At the same time, the stock market is being primarily driven by the AI hyperscalers – the Magnificent Seven stocks. Why could that disparity exist? One reason is what we call the K-shaped economy. This represents the income disparity between the top buckets of the income distribution and the middle and lower buckets. Income and wealth disparity is nothing new – it's been around for a long time – but since the pandemic, this gap has widened significantly. The top 20% of the income distribution has been doing much better and gaining ground, while the bottom 80% is losing ground. I'm measuring that by growth in personal spending and personal outlays, which represents about 70% of our GDP. Since 2020, personal outlays by the top 20% have grown about 60%. For the bottom 80%, outlays have just barely outpaced inflation – prices are up about 30% since 2020, and outlays for the middle and lower end of the distribution are up just about 31%. For reference, the top 20% I'm referring to are households making about $200,000 a year or more. The middle income cutoff is about $72,000 a year. Tariffs disproportionately hurt middle- and lower-income households because they do much more of their spending on goods than on services. High-income households spend more on financial services, vacations, travel, entertainment and eating out. Middle- and lower-income households spend more on food, gasoline, appliances and other durable and nondurable goods – many of which have been tariffed. Immigration policy is similarly more disruptive in the labor market for middle- and lower-income households. For the top part of the K, the story is the enormous surge in household wealth – primarily through housing wealth and stock market equity. People in the top 20% are much more likely to own homes than rent, and much more likely to be invested in the stock market. They've enjoyed the benefits of both rising home prices and a rising market. Since 2022 – when ChatGPT was rolled out in November – we've seen enormous equity gains. That's powered what I call the wealth effect: For every additional dollar in equity market wealth, people tend to spend about 5 cents. The risk, of course, is that the opposite happens when wealth falls – and there's evidence that people pull back more on the downside than they spend on the upside. For the bottom 80% of the income distribution, the labor market is now quite weak. In 2025, we added only about 150,000 jobs on net for the entire year – the worst showing outside of a recession since about 2003. The unemployment rate didn't move much, however, because the labor force has essentially stopped growing, largely due to immigration policy. We're also seeing the hiring rate drop to a 15-year low. What this means is: If you have a job, you're probably OK. But if you lose a job or are entering the market for the first time – like a new graduate – it has become increasingly difficult. At the same time, since the war with Iran started in February, we've seen inflation pick up from just above 2% to much closer to 3% year over year. Inflation is now swamping wage gains for most people. We got an inflation report yesterday that was better than expected, but I don't think that lasts – as of this morning's headlines, we're back to full-scale conflict with Iran, the ceasefire is over and the Strait of Hormuz is closed again. We're running out of oil inventories – the Strategic Petroleum Reserve is lower than it's been since 1983, with probably about 100 days left. If this goes on longer, we risk oil prices spiking well above $100 a barrel and potentially a recession. Putting it together: The estimated cost of the war to households has been about $1,000 per household since February – about $17 billion total in additional energy costs – which is now swamping the average $400 boost in tax refunds households received this year. Real disposable income is falling and the personal savings rate is approaching 3%, the lowest we've had outside of a recession. Households are tapping savings to afford monthly bills. Our outlook really hinges on the outcome of the war. If we can get the Strait of Hormuz open and oil flowing again by Labor Day, I think we escape the year without a recession and can stick to that 2% growth forecast. If it goes on longer, it starts to bleed into supply chains and there's much more room to worry.
JESSICA KEARNEY: Thank you, Marisa – that was a terrific overview. I really appreciated your thoughts on the K-shaped economy, drilling down on consumer spending, consumer confidence and that remarkably low savings rate. Let's go to inflation. You mentioned we got some data yesterday that was slightly better than expected. Can you compare what we're seeing now to the post-COVID inflation era? A lot of us have 9% inflation from 2022 burned into our memories. How does this compare?
MARISA DINATALE: It's a good question and one I've been thinking about more as this war drags on. When does this become entrenched, the way it did coming out of the pandemic? It's a little different. Back then, there were two things happening simultaneously. One was the global reopening in 2021 – we'd all been shut in, ordering Amazon packages, and then the vaccine rollout happened and things started to reopen. We had this surge of demand at the same time we were still grappling with supply shortages from the pandemic – Chinese ports were still backed up, the chip shortage was in full effect. Then in early 2022, Russia invaded Ukraine and added more supply chain disruptions – xenon, neon, sunflower oil, all of these commodities flowing through that part of the world were in very short supply. A lot of economists called that inflation transitory, and they were wrong – it was much more entrenched than anyone realized. What we're seeing now is different. With an oil price shock like the one we're experiencing from the war, it tends to be more flexible and can bounce back more quickly. The risk is that it starts to have broader supply chain effects. We're talking about 20% of the world's oil exports coming through that region – it's a big constraint, but it's not everything. There are other oil sources that can be tapped, and the products flowing through the Strait of Hormuz aren't as pervasive as what we saw during COVID with China's exports being hampered. And you saw that play out when the ceasefire was signed a few weeks ago – gas prices and oil prices came down quite a lot, which is why the CPI fell yesterday. I'm expecting that to reverse when we look at the numbers next month. But that just shows it is different – an oil price shock tends to be shorter-lived than a more pervasive supply chain shock.
JESSICA KEARNEY: That's really helpful as a lens for tracking the headlines in the months ahead. Core CPI is running at 2.6%, still above the Fed's 2% goal. Do you see a path back to target, and on what timeline?
MARISA DINATALE: Yes. We're forecasting that we get back down to around 2% inflation by 2028 – probably a couple of years out. The Fed is very focused on inflation right now. They have a dual mandate to balance full employment with a 2% inflation target – and I should note that target is measured on the PCE deflator, not the CPI, though both are well above target. So there's much more likelihood of another rate increase this year than any rate cuts, which are almost totally off the table right now. We have penciled in one rate hike for later this year. Most markets are penciling in two. If we can get inflation under control and wrap up the war situation so oil can flow normally again, I think we can get back to 2% by 2028.
JESSICA KEARNEY: You mentioned the labor market earlier. Where is job growth slowing and where is it holding up? Are there different pockets within those overall numbers?
MARISA DINATALE: Absolutely. Job growth as a whole is running at about 100,000 a month on the payroll survey, though we think underlying job growth is probably closer to 70,000 to 80,000 a month. What's most concerning is that almost 90% of the jobs added in the past year have come from essentially one industry: healthcare. Outside of healthcare, there's been almost zero job growth. We've seen some growth in leisure, hospitality and retail – there's some speculation that may have been temporarily boosted by preparations for the World Cup, which means those jobs will likely disappear once the tournament ends next week. We're seeing outright declines in manufacturing, financial services and professional services. And the worry there is that the declining industries tend to be the higher-paying ones, while the industries actually adding jobs tend to be lower-paying. That's contributed to nominal wage growth slowing as well.
JESSICA KEARNEY: You also touched on demographics. We actually had a webinar on workforce demographics and shrinking labor supply just a few weeks ago. We're getting a question from Allie in the audience: As 40% to 45% of boomers have not yet but will soon retire, what's your perspective on the outlook and its interplay with the economy – and the transfer of wealth and estates?
MARISA DINATALE: It's a huge demographic shift that is underway and has been underway for some time. The boomers are an enormous population group. If I just look at people in their 60s, they make up about 10% of the current labor force – meaning 10% of the labor force is at or near retirement age and will likely retire within the next 10 years. We do have big demographic groups behind them – millennials and Gen Z are actually larger than the boomers – but with their retirement goes a lot of institutional knowledge, people who have been with their companies or in their industries for a very long time. You may be able to replace them with younger workers, but there might not be as much productivity initially in that transition. Just looking at the aging of the population in isolation, the labor force will be in outright decline by 2050. That assumes current immigration policy stays in place. Typically, immigrants – who tend to be younger and in their prime working years – have replaced a lot of the people retiring. That replacement factor has been very much curtailed. So that means lower potential growth for the economy. On the wealth transfer question: It's tricky because it's happening over a very slow, drawn-out time horizon – it's been going on and will continue to go on for decades. I don't think it's going to be a shock event where we see a massive transfer of wealth happen in one or two years. And we're also seeing that a lot of older people are staying put – the number of single or couple households living in homes more than 3,000 square feet is at an all-time high, so there's not as much real estate transfer happening as we'd expect. It's kind of an iceberg moving through time.
JESSICA KEARNEY: We're getting an additional question: How will declining birth rates impact the overall economy – especially in combination with boomers retiring and thinking about government expenditures like Social Security?
MARISA DINATALE: The natural increase in population – births minus deaths – is not going to be enough to keep the population growing at all. Without immigration, we will see population decline in this country, similar to what Japan experienced: decades of slow growth, deflation, low GDP growth, because you had a very old population aging quickly and people weren't having babies and they were very restrictive with immigration. We're not on that magnitude at all, but that's broadly the direction we'd be heading if current trends continue. Want to put a pin in that – let's talk about interest rates and the bond market first, and then we can get to the national debt.
JESSICA KEARNEY: Sure. Why do elevated treasury and bond rates matter so much for consumers, businesses and the broader economy?
MARISA DINATALE: Most interest rates people pay – whether it's a mortgage rate or a credit card rate – are benchmarked to a Treasury yield. A 30-year fixed mortgage rate, for example, is benchmarked to the 10-year Treasury yield. As Treasury rates rise, all interest rates across the economy generally go up. We've seen that play out over the past few years as the Fed has raised rates and as the fiscal health of this country has become more concerning – bond yields have risen and mortgage rates have nearly doubled, going from around 3 percent in 2021 to closer to 6 percent today. That makes things extremely unaffordable. We would basically need mortgage rates to fall to near zero to get back to the affordability levels of five years ago – and that's not going to happen.
JESSICA KEARNEY: What is the bond market signaling right now?
MARISA DINATALE: There are expectations that inflation has notched higher, so investors need a higher return because inflation is eroding some of their investment. There's also concern about the trajectory of our debt-to-GDP ratio. We've recently passed the 100% threshold. That in itself isn't necessarily a problem, but psychologically to bond investors, it doesn't sound good. And the trajectory is up. At the same time, we've cut taxes, we're taking in less revenue, the job market has slowed and now we're paying for a war. All of that adds up to a worsening fiscal situation. And honestly, I don't think there's any political appetite to do anything about it until there's some sort of crisis – until the U.S. is about to default on some of its debt, or foreign investors start pulling out of Treasury securities. It's not sustainable, but I don't see the impetus for anyone to deal with it until they're forced to. We are now spending more on interest payments on that debt than we were spending on national defense before the war. That's pretty stark when you think about it.
JESSICA KEARNEY: You mentioned on your podcast, Inside Economics, that you play a trivia game called the Stats Game. We're going to do it here for our audience. Do you want to explain how it works?
MARISA DINATALE: Sure! Every week on the podcast, my co-hosts and I try to stump one another with a statistic – usually one that's recently released or that we want to use to spark a discussion. We give the statistic and then the others try to guess what it refers to.
JESSICA KEARNEY: Perfect. So we're throwing up a polling question for our audience. Marisa, your number is 2% – and we want our audience to guess out of three options what that 2% equates to: the share of businesses that say AI has reduced their headcount in the last six months; the unemployment rate of college graduates; or the five-year-ahead expectation for annual inflation. The audience voted: 68% went with the five-year-ahead inflation expectation, with about a quarter guessing the AI headcount reduction. Marisa, the big reveal?
MARISA DINATALE: You might get a little frustrated with me when I tell you this – but you'd all be close no matter what you picked. These are all two-point-something percent. The one I was thinking of, 2% on the dot, is the first one: the share of businesses that say AI has led to employment declines in their business over the last six months. The unemployment rate for college graduates is about two and a half percent. And the five-year-ahead expectation for annual inflation is about 2.6% to 2.7% right now. So they're all in a similar range – but the answer I had in mind is the AI impact on employment.
JESSICA KEARNEY: Anything more to dig into there? With all the AI headlines, I think some people might have expected a different number.
MARISA DINATALE: It's very interesting. There are two things going on with AI and the economy. One I've already discussed – the enormous spending by AI companies is juicing capital investment and construction of data centers. What's less clear is what AI is doing to productivity growth. I personally don't believe we're seeing a measurable positive productivity impact yet. It's too early. On the employment side, this comes from a Census Bureau survey conducted every couple of weeks that asks businesses across all industries how they're using AI and how it's affected employment levels. As of the latest read, only 2% say AI has led to a reduction in employment. Interestingly, about 3% say it's led to an increase in employment. And this is true across every industry – even tech, where we keep hearing that AI is causing big layoffs. It actually seems to be adding more jobs than it's subtracting right now. I've become increasingly more sanguine about AI being more complementary to most people's jobs rather than a replacement. I think of it more like the way we saw the internet, personal computers or smartphones – those things did eliminate some jobs but also created a lot of new ones we couldn't have conceived of beforehand. I think AI will do the same. But I don't stand firmly on that ground, because it's evolving so quickly and it's really anybody's guess.
JESSICA KEARNEY: I think that answered a lot of audience questions all at once. Let's transition to trade policy. Can you give us an update on where trade stands and how it's factoring into Moody's forecasts?
MARISA DINATALE: When President Trump came into office in early 2025, he enacted very broad-based tariffs on almost every country and trading partner – though with a lot of exceptions and differing rates. The courts struck a lot of that down, but the administration turned around and used a different statute to implement tariffs again. Right now we think the effective tariff rate is about 8%. For context, before he came into office, it was more like 2% to 3% – so effectively a quadrupling. Most of the negative impact of that is behind us. It took more out of growth in 2025 than it will this year or next. There's still uncertainty, particularly around the USMCA — the trade agreement that replaced NAFTA and governs trade between the U.S., Mexico and Canada. Mexico is now our biggest trading partner, and the administration has raised doubts about whether they want to renew it, which has heightened trade war concerns. That said, I think most companies have been able to navigate through this by absorbing a lot of those costs themselves rather than passing them on to consumers. If you look at the CPI and tariff-sensitive goods, prices for those have grown faster than non-tariff-sensitive goods – but the impact was probably less than many people thought, partly because businesses and in some cases exporters absorbed those costs. It's still a net negative for the economy, but it's waning. And it's unlikely that this level of tariffs stays in place through the next administration – I think there'll be some relief on that front eventually.
JESSICA KEARNEY: We have the U.S. midterm elections coming up in November. Is there anything your team will be watching in particular in terms of the economy as a result?
MARISA DINATALE: I think it's interesting to see whether there's a hastening of efforts to end the Iran war before the midterms. People vote with their pocketbooks. They drive by a gas station every day and see what's happening with gas prices. That very strongly impacts consumer confidence and views of the economy. So I would think it's in President Trump's best interest to try to get inflation under control, and the easiest way to do that is to resolve the Iran situation. Regardless of what happens with the war, I think we're likely to see a more divided Congress – possibly a split Congress – which would make it harder for bills to get passed, though a lot of things have been done by executive order and have bypassed Congress entirely. So regardless of the outcome, I'm not expecting huge changes in policy over the next couple of years.
JESSICA KEARNEY: We've got questions from Joanne and Shawna asking about the outlook for the housing market – both generally and specifically around residential construction. Is there likely to be upside or downside from here?
MARISA DINATALE: I would almost characterize the housing market as being in a recession for the past few years. As interest rates have risen, there's really been a standstill on home buying. Affordability is at an all-time low, and it's very difficult, particularly for first-time homebuyers, to get in the door. A housing bill was just passed. It has some provisions aimed at increasing the supply of housing, which is encouraging, because I think a lot of housing policy we've seen has tried to make housing more affordable by juicing up the demand side while ignoring supply. The real problem with the housing market now is that there's simply not enough supply. We estimate a deficit of about 2 million homes. And I don't think this bill really closes that gap – a lot of the problem is local. Federal government action can only go so far, because a lot of it comes down to local ordinances, zoning and land use. That's stuff localities have to tackle on their own. On the positive side, demographics might actually help the housing market over time – baby boomers eventually moving out of their homes could bring more supply to market. But rents are in outright decline now, which helps affordability for renters but isn't an incentive for builders to put new units in the ground. The short answer is: more of the same. Very weak appreciation – nationally about 1% to 2% per year for single-family existing homes. Some softening on multifamily. On the ownership side, I don't see much relief unless local governments really change housing policy and make it more feasible for builders to construct affordable starter homes.
JESSICA KEARNEY: We'll leave it there for the housing market. Marisa, we're at the top of the hour. Any final thoughts or bright spots as we look ahead into 2027?
MARISA DINATALE: I do see some bright spots. Going back to AI – I think it has real potential to transform productivity growth, even if that's not what's happening right now. If I look five years ahead, I think we have the potential for a much faster-growing and much more productive economy. It may cause transition pain for some segments of the labor market, and we'll have to figure out how to educate people toward the new jobs that are created. But I do see it as a bright spot. And I'll say that when you look around the world, the U.S. has cornered the market on AI infrastructure. We've heard a lot about Chinese AI models and technology starting to catch up – that's certainly a concern – but right now, when you look at where the data centers are and where the big companies are headquartered, the U.S. is the hub. If we can keep that position, it should serve us well in the global economy for years to come. I would also say that coming out of the pandemic, the labor market has become much more flexible. Remote work, hybrid work, new ways of working – these things make it easier to work and easier to balance work with the rest of your life, if you're lucky enough to have an employer that allows it. The data suggests that the hybrid-remote balance has leveled off and is likely to stay roughly where it is over the next five years. I view that as a good thing.
JESSICA KEARNEY: That's great. We'll leave it there. Marisa, we are so appreciative of your time. I hope everyone checks out the Inside Economics weekly podcast – we know you and your team are doing great work at Moody's Analytics, so thank you for spending this hour with us, helping our audience connect all the dots and all the headlines we read on a day-to-day basis.
MARISA DINATALE: Thanks for having me. I really appreciate it.
JOAN WOODWARD: Thank you for joining us for this insightful conversation. Check out our show notes for more information about the Travelers Institute and to sign up for our mailing list and LinkedIn newsletter. If you enjoy our content, please be sure to subscribe, rate and review on Apple Podcasts and Spotify. You can also contact me by following me on LinkedIn or emailing [email protected] to let me know what else you'd like to see and hear from the Travelers Institute. Thanks again for listening.
Learn more, explore the most recent episodes and subscribe to the Travelers Institute Risk and Resilience podcast.
This episode is also available on Apple Podcasts®.
Summary
What did we learn? Here are the top takeaways from A Tale of Two Economies with Marisa DiNatale of Moody’s:
The rise of AI is helping to offset negative economic factors and fuel growth, DiNatale said.
“The U.S. economy is growing at a rate of 2%. It’s performing better than expected given some of the headwinds we’ve faced,” she explained, pointing to the ongoing conflict with Iran and the effects of immigration policy and baby boomer retirements on the workforce. “That’s taking some juice out of the economy,” she said, citing the Iran conflict as the top reason the economy hasn’t reached a potential growth rate of 2.5%. On the flip side, investment in AI data centers is “juicing capital spending,” driving stock market growth and helping to offset these negative economic trends. “The economy is growing, but that growth is pretty tenuous,” she said. Watch at 03:24
Higher-income households are driving U.S. economic growth, DiNatale noted.
Current economic conditions are favorable for the top 20% of consumers, made up of households making at least $200,000 a year, but less so for everyone else, she explained. This phenomenon is sometimes referred to as a “K-shaped economy” based on how it looks on a graph. “Consumer confidence is at rock bottom at the same time we have a stock market that’s going gangbusters,” she noted. Consumer spending is about 70% of what drives the economy, she pointed out, and the bulk comes from higher-income households benefiting from stock market performance and increases in housing wealth. “It goes back to the wealth effect: If you look wealthier on paper, you’re more likely to spend in real life,” she said. Watch at 07:47
A resolution to the conflict in Iran may keep the economy growing, suggested DiNatale.
Inflation has picked up since the Iran conflict began and it now sits higher than 3% on a year-over-year basis, she explained, noting that the conflict has cost about $1,000 per U.S. household. And U.S. oil reserves have dipped to the lowest levels since 1983, with about 100 days’ worth of oil left, she pointed out. As oil prices rise, consumers pay more at gas pumps and grocery stores, she added. “The vast majority of households are starting to face real financial strain,” she said, noting that the odds of a recession will increase if the conflict continues. But, she predicted: “If we can get the Strait of Hormuz open and oil flowing again by Labor Day, then I think we escape the year without a recession and stick to a 2% growth forecast.” Watch at 19:10
The fiscal health of the country continues to shape the U.S. economy.
Elevated treasury and bond rates affect the amount consumers pay in interest on products ranging from credit cards to mortgages, DiNatale explained. “It has real impacts on consumers,” she said, noting that the bond market shows that investors want to see higher returns because of inflation. There is also concern about the ratio of the national debt to the gross domestic product, which recently passed 100%, and the U.S. government is now annually spending more on interest than on U.S. military and defense, she said. “It’s unsustainable,” she noted, adding that it might take a crisis to get the issue addressed: “I don’t see an impetus for anybody to deal with it until they’re forced to deal with it.” Watch at 40:33
Job growth stems largely from one industry: healthcare.
About 90% of jobs added over the past year have come from the healthcare industry, DiNatale said. “Outside of healthcare, there has been almost zero job growth,” she stated, adding that hiring is at a 15-year low as employers grapple with economic uncertainty. On a brighter note, there has been no big uptick in layoffs, and a Census Bureau survey that asks businesses across all industries about AI shows that only 2% of respondents say the technology has reduced employment. At the same time, 3% say that it’s increased employment at their company. “This is true across every single industry, even the tech industry, where we keep hearing that AI is the cause of big layoffs,” she said. Watch at 33:25
Webinar resources
- Explore past episodes and subscribe to the Moody’s podcast Inside Economics.

Wednesdays with Woodward® webinar series
Wednesdays with Woodward is a webinar series hosted by Joan Woodward featuring candid talks with industry and government thought leaders on today’s top challenges.

Workforce initiative
This program is presented as part of the Travelers Institute’s Forces at Work initiative.
Webinar presented by





Related content
America’s Shrinking Workforce: How Demographic Trends Are Reshaping the U.S. Economy
For the first time, the U.S. is facing a future where each generation is smaller than the last, even as people live longer than ever. Luke Pardue, co-editor of a landmark report by the Aspen Economic Strategy Group, joined us to explore what this means for labor markets, public finances and businesses.
Real Estate Market Outlook with National Association of Realtors® Chief Economist Lawrence Yun
What’s the latest in the real estate market and what does it mean for the broader economy? National Association of Realtors Chief Economist Lawrence Yun joined us to discuss the state of the residential and commercial markets and what that means for buyers, sellers, renters, investors and the insurance industry.
Economic Outlook with U.S. Chamber of Commerce Chief Economist
Curtis Dubay, Chief Economist at the U.S. Chamber of Commerce, joined us to discuss the headwinds and tailwinds facing the U.S. economy, including inflation, interest rates and the labor market. He examined the impact of new tax law on businesses and reported on the current legislative outlook.