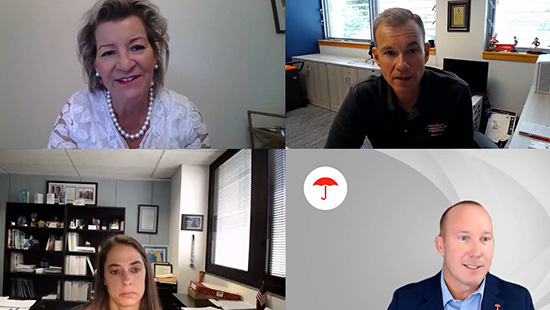
Inside the National Hurricane Center: Advanced Forecasting, Better Preparedness

Inside the National Hurricane Center: Advanced Forecasting, Better Preparedness
June 10, 2026
Wednesday 1:00 p.m.-2:00 p.m. ET
Key takeaways
- The National Hurricane Center (NHC) is introducing changes to how it communicates hurricane risks starting this season, including featuring inland watches and warnings on the NHC Track Forecast Cone.
- Preparation and mitigation strategies are key for the 2026 hurricane season and beyond. It’s important to check equipment like generators and shutters and stock up on supplies before the season starts so you don’t run out of time to get what you need.
- According to government data, there is a 90% chance of a near normal or below normal Atlantic hurricane season this year in part because of this year’s unusually strong El Niño. However, major hurricanes can hit with very little warning, even in an El Niño year, and preparation is imperative.
- Storm surge, an abnormal rise in water level from a storm’s wind, was once the leading cause of hurricane deaths, but more advanced forecasting, earlier warnings and higher evacuation rates have helped drive that number down.
- One helpful tip: Make sure your phone can get National Weather Service wireless emergency alerts, as hurricane and storm surge warnings are among the few notifications the NWS can push to your phone.
For insurance professionals, hurricane season is never just a weather event – it's a test of preparation, knowledge and client trust. Jamie Rhome, Deputy Director of the National Hurricane Center (NHC), joined us for a deep dive into the 2026 season outlook and what's new from the NHC for 2026. He provided an in-depth look at the latest forecasting technology and AI tools, insight into how the NHC assesses wind and storm surge hazards, and practical strategies to help your clients mitigate risk.
This program is presented as part of the Travelers Institute’s disaster preparedness initiative, which works to raise awareness about the risks posed by natural disasters and how communities and businesses can respond and recover, as well as the Risk. Regulation. Resilience. Responsibility. initiative, addressing the affordability and accessibility of P&C insurance.
Watch webinar replay
(SPEECH)
[MUSIC PLAYING]
(DESCRIPTION)
Slide Text: Wednesdays with Woodward (registered trademark) Webinar Series. A laptop appears with a title on its screen: Wednesdays with Woodward (registered trademark) Webinar Series. To the right of the laptop, a red mug features a Travelers umbrella logo. Logos: Travelers Institute (registered trademark), Travelers.
(SPEECH)
JESSICA KEARNEY: Hello and welcome. I'm Jessica Kearney, Vice President here at the Travelers Institute, the public policy division of Travelers. And I'm standing in for our host, Joan Woodward, today. So thanks again for joining us for this special hour dedicated to hurricane preparedness. It's going to be a great one. And we have a fantastic guest lined up in just a few minutes.
(DESCRIPTION)
Text: About Travelers Institute (registered trademark) Webinars. -- The Wednesdays with Woodward (registered trademark) educational webinar series is presented by The Travelers Institute, the public policy division of Travelers. This program is offered for informational and educational purposes only. You should consult with your financial, legal, insurance or other advisors about any practices suggested by this program. Please note that this session is being recorded and may be used as Travelers deems appropriate.
(SPEECH)
Before we get started, as always, I'd like to share a quick disclaimer about today's program.
(DESCRIPTION)
Wednesdays with Woodward (registered trademark) Webinar Series. Inside the National Hurricane Center: Advanced Forecasting, Better Preparedness. Logos: Travelers Institute (registered trademark), Travelers, Master’s in Financial Technology (FinTech) Program at the University of Connecticut School of Business, Metro Hartford Alliance, University of South Carolina Darla Moore School of Business, Big I (registered trademark), Independent Insurance Agents and Brokers of America, Insurance Association of Connecticut, American Property Casualty Insurance Association (service mark), Insuring America, a p c i dot org.
(SPEECH)
I'd also like to thank our program partners, the MetroHartford Alliance, the Risk and Uncertainty Management Center at the University of South Carolina's Darla Moore School of Business, the American Property and Casualty Insurance Association, the Master's in FinTech Program at the University of Connecticut, the Insurance Association of Connecticut, and the Big I. As always, a special thank you and welcome to all the members and students joining us today.
So we have officially entered the start of hurricane season. And at the Travelers Institute, today's program is really part of a long history of promoting education and disaster preparedness alongside community resiliency. So many of you in our audience are deeply involved in all things risk management, whether it's on behalf of your state or your local community or the clients that you're serving day in and day out.
So today's session is going to help us all understand hurricane risk at a deeper level and hopefully allow us to better interpret that risk for all the various stakeholders that we serve. So, thank you for showing up so we can learn alongside each other today.
Today is also part of a new educational platform here at the Travelers Institute addressing a critical issue-- the availability and affordability of property and casualty insurance.
(DESCRIPTION)
Text inside a speech bubble reads: Risk. Regulation. Resilience. Responsibility (service mark). Below the speech bubble, the Travelers Institute (registered trademark) and Travelers logos appear.
(SPEECH)
We're calling it Risk. Regulation. Resilience. Responsibility. All of those four words chosen very carefully. And we are traveling all over the country.
We were in Salt Lake City and Houston just last week hosting dialogues on this pressing topic, including how resiliency efforts, like some of the ones we're going to talk about today, can help bend the risk curve down for individuals, for businesses and for communities at large.
This is all part of the resiliency and community resilience conversation that we're having. So we're going to add that to the conversation today, how we can better help protect lives, property and entire communities from hurricane risk. So I invite you to check out more about that initiative. We're going to drop a link to it in the chat.
So I mentioned we have a fantastic guest.
(DESCRIPTION)
Text: Wednesdays with Woodward (registered trademark) Webinar Series. Today's Speaker: Jamie Rhome, Deputy Director, National Hurricane Center.
(SPEECH)
Without further ado, I'm thrilled to welcome Jamie Rhome, who is the Deputy Director of the National Hurricane Center. And we're going to learn a lot more about the center today, which is based in Miami on the campus of Florida International University.
And its mission is to save lives, mitigate property loss and improve economic efficiency by issuing all of those watches and warnings and forecasts that we see and analysis of hazardous tropical weather and by increasing understanding of those hazards like we're helping to do today.
So Jamie is a nationally recognized subject matter expert on storm surge. We're going to get into that as well, coastal inundation. And he oversaw the Hurricane Center's Storm Surge unit, which produces official forecasts and coordinates post-storm response and recovery efforts.
His pioneering work there earned him numerous honors, including the 2019 Service to America medal. Jamie was with us back in September of 2023. And we're thrilled to welcome him back to talk about the 2026 hurricane season and then dig into more of the work that the National Hurricane Center does.
Jamie, thank you so much for being with us today. The floor is yours. We're looking forward to hearing from you.
JAMIE RHOME: Thank you for having us today. This is a treat. And for all of you out there that took time from your busy schedules to listen today, thank you for your attention and respect on a topic that is near and dear to my heart and will certainly probably be at the forefront of your minds at some point this hurricane season, despite what the headlines may or may not lead you to believe regarding El Niño.
And since El Niño is the elephant in the room, I will start right off with it. The seasonal forecast issued by NOAA is before you. Now, NOAA is not the only entity in town that issues a seasonal forecast. You've probably heard seasonal forecasts, information or headlines going back to April. And NOAA only recently in May released its seasonal forecast. And many of you might ask, well, why is that?
And I'm known for being sort of a bottom-line guy. And quite simply, there is no predictability in the seasonal forecast prior to May. There's just very limited knowledge and information out there for longer lead times. It doesn't mean you can't say something about the season at those earlier times. But generally speaking, you got to get into May to have enough predictability. So that's why NOAA waits to that point.
So here we are. And there's already some nuance here. You're probably scratching your head and saying, well, wait a minute. I heard on the news that this was like a historic El Niño, which is going to block all hurricanes from forming, much less moving towards the United States. That's often how things get distilled in this world of headlines or clickbait or social media posts. But the truth is, the impact of El Niño on the seasonal forecast is much, much more nuanced than that.
And we'll start simply by the prediction itself. So you notice there it's a 55% chance of below normal, which I'm no math guy. That leaves 45% chance of something else, of which 35% would be near normal. So there's your first nuance right there. There's still some probability that the hurricane season will be near normal.
Now, you're asking yourself, why is that? I mean, we see all this news about El Niño. So what we can say confidently about El Niño is pretty high certainty it's going to develop and a pretty high certainty that it's going to be a strong one. What we don't know is when it officially develops and how strong it will be relative to the peak of hurricane season.
The other thing that's a nuance here is there's often a lag in the response of hurricane season to El Niño. So let's say that El Niño really starts cranking in August. Well, that means everything before August is-- can go ahead and develop as normal. So you can see it there. There's the typical ranges, what NOAA is predicting.
(DESCRIPTION)
2026 NOAA Seasonal Forecast, Atlantic. 90% chance of a near normal to a below normal season, 8 to 14 named storms, 3 to 6 hurricanes, 1 to 3 major hurricanes, Do not know where these storms will form. Remember: It only takes one! 1991 to 2020 Averages: 14 named storms, 7 hurricanes, 3 major hurricanes. A pie chart titled 2026 Atlantic Hurricane Season Outlook Season Probability appears, with an orange wedge that represents an Above Normal probability of 10%, a blue wedge that represents a Near Normal probability of 35%, and a green wedge that represents a Below Normal probability of 55%. Text: Be Prepared. Visit hurricanes.gov and follow NOAA's at N.W.S. and at N.H.C. underscore Atlantic on X. -- May 2026, Forecast for overall seasonal activity. Not a hurricane landfall forecast. Department of Commerce, National Oceanic and Atmospheric Administration, weather.gov.
(SPEECH)
There's the forecast. And then, I talked a lot about the probabilities in the pie chart there. So I'll let everybody digest that really quickly. But really, the take-home message for you is these are the total number-- the seasonal forecast, the total number of storms across the entire Atlantic basin and Caribbean and Gulf. So it doesn't tell you anything about your individual location or you, individual person. It's basically a bulk number; how many storms will form in the Atlantic? And of those, how many will go on to become strong?
So it doesn't tell you anything about individual risk, which is, by and large, what everybody wants to know. You're probably interested in whether or not your home could or could not be impacted.
(DESCRIPTION)
Competing Factors. Expected Atlantic Conditions August through October 2026, Competing Factors. On a map of the Atlantic Main Development Region, a blue arrow labeled "Competing El Nino " points to the right from the coast of Central America while green arrows labeled "Neutral West African Monsoon, weaker easterly trade winds" points to the left. A red region in the ocean between the northern coast of South America and the northwestern coast of Africa contains cloud graphics and the text "Above average vertical wind shear, Warm Sea Surface Temperatures."
(SPEECH)
There's other aspects of El Niño that get lost in these discussions. El Niño is not the only game in town. So it's one of many, many factors that go into the seasonal activity at large.
You've heard one of those other factors, the ocean temperature. You've heard about this. So warmer temperatures in the ocean tend to enhance activity in the Atlantic, whereas El Niño tends to suppress activity. So those two factors are sort of duking it out, if you will. And that's what goes into all of this. And there's other factors that come into play.
But the point I wanted to make with this graphic is the primary influence, or the strongest influence of El Niño on the Atlantic season is focused in that little red box, that little red area there, or what we call the deep, tropical Atlantic. And I'm guessing most of you are not in that red box. I'm just going to go out on a limb. Most of you are not in that red box. So the areas outside of the red box, while they still experience the suppression of El Niño, it's not quite as strong.
So all of that to say is don't get distracted by the headlines of this massive, historic, first-of-its-kind, never-recorded El Niño, because that's going to cause you to be distracted and not be prepared. I've already pulled out both of my generators and tested them and tuned them up.
I think that's the bottom-line take-home right there. If I'm prepared, you should be too. We've had the staff here at the Hurricane Center go through preparedness drills. They're still going through preparedness drills. That's both preparedness in the formulation of the forecast and preparedness in their home, personal lives as well. So there's your take-home message.
(DESCRIPTION)
Text: 2026 N.H.C. Product and Service Updates. Cone graphic with inland U.S. watches and warnings (now operational), Gray "X" on Graphical Tropical Weather Outlook for disturbances in which development is not expected, Storm surge watches and warnings, Peak Storm Surge Graphic, and Potential Storm Surge Flooding Map for the Hawaiian Islands, Mobile friendly version of Hurricanes.gov front page, Experimental Cone of Uncertainty based on 90% along and cross-track errors versus 67% absolute errors (ellipses versus circles), Will serve as a vehicle to include depiction of inland international watches and warnings as available.
(SPEECH)
Now, regarding what's new for the hurricane season, a lot of updates. We often get the question, what do you do in the offseason when there's no storms? Well, quite simply, we're developing new forecasting techniques, new communication techniques, updating our suite of products. Here is a list of what I'll be talking about today. For most of you, you'll be most interested in the cone updates. And we'll certainly spend a fair amount of time on that. And it's also the part that I'll lead off with.
(DESCRIPTION)
Cone of Uncertainty, Inclusion of Inland U.S. Watches and Warnings. N.H.C. cone of uncertainty with inland U.S. watches and warnings becomes operational in 2026. Key features: Inland U.S. watches and warnings, one shading for entire 5-day cone. Better representation of both coastal and inland wind risk. On the right, a cone of uncertainty graphic for Hurricane Milton on Tuesday October 8, 2024 includes sections for Current Information, Forecast positions, Potential track area, Watches, Warnings, and Current wind field estimate. Text: Note: The cone contains the probable path of the storm center but does not show the size of the storm. Hazardous conditions can occur outside of the cone.
(SPEECH)
So the cone of uncertainty, the cone of certainty, the cone of many things, I've heard it called so many things over my 25-year history here. There's a picture of it just so you know what I'm talking about. I think everybody here is familiar with this product. There is only one cone. It comes from the Hurricane Center. That's us. It originates from us. Obviously, people will polish it up or add features and capabilities to it to make it look a little bit differently. But here is our cone.
And what you notice outside of the white area is a lot of color, a lot of color over Florida. Those are the wind watches and warnings, specifically a tropical storm watch or warning or hurricane watch or warning. And the reason on our cone they're depicted so vividly and strongly is because we believe they're the most important thing we issue.
Of all the products we issue at the National Hurricane Center, the wind watches and warnings or the storm surge watches and warnings are the ones that we put the most time in. Sometimes an hour goes into the decision of whether or not to issue a watch or warning and where to issue it.
The cone takes a second running on an automated piece of software. So this is our signature product, we think, is the watches and warnings. Yet, very few people focus on them or look at them. So starting this year, they will be featured prominently on the cone because that's what we want people to focus on. It's the actionable information.
And if you notice over Florida, if you kind of eyes focus in over Florida, the cone disappears behind the watches and warnings over land. That's on purpose. That's basically us saying, this is what's most important for you. Now, if you've been paying attention, you probably noticed that we've done this experimentally in the background over the last couple of years.
That experiment was successful. We do extensive polling and allow people to fill out surveys or email us. And over 90% of those surveyed or who sent us feedback felt this was a positive change. And getting 90% of people to agree on anything these days is pretty difficult. So we felt this was an overwhelmingly positive change. And we went ahead and made it. It is now the operational cone.
(DESCRIPTION)
Cone of Uncertainty, Web Posting. N.H.C. will post the cone with inland U.S. watches and warnings when the full advisory package is disseminated (by the top of the hour). In rare circumstances, a "preliminary" cone with only coastal U.S. watches and warnings may be posted until a final version with inland U.S. watches and warnings is available. On the right, the word "Preliminary" marks a version of Hurricane Milton's cone of uncertainty graphics. The cone extends through Florida with color highlights on Florida's coasts that indicate hurricane and tropical storm watches and warnings.
(SPEECH)
Now, I'm going to contrast this to the way the cone has historically looked from us, where we only focused on the coastal aspects. And I'm going to go back and forth here so you can see the change in the depiction.
(DESCRIPTION)
The slides flip back and forth between the 2026 cone of uncertainty graphic, which features inland shading for U.S. hurricane and tropical storm watches and warnings, and the older cone of uncertainty graphic, which features only coastal shading.
(SPEECH)
So the old way where we only depicted the coastal kind of gave people this perception that the inland wind risk wasn't there or had decayed or this sort of thing. And you can see now this better overall depiction shows a more holistic risk assessment, which is what we're here to talk about is risk.
The other thing too is if you look at the red area, which denotes a hurricane warning, you can see how far the red sort of goes inland. It almost crosses the entire Florida peninsula. And often, this is one of the tougher parts for people to understand is people think that the only damaging impacts are going to be at the coast. And in some of these storms, especially some of the more recent storms, we're seeing these storms carry the damaging impact much, much further inland.
(DESCRIPTION)
On the cone of uncertainty graphic for Hurricane Milton, red shading extends inland from the Gulf Coast of Florida toward Orlando.
(SPEECH)
Look at this example. This is of Milton, the I-4 corridor there with Orlando. Often, it can be very difficult to message to people that far inland that they're going to get hurricane force conditions. So this is a great way, I think, to highlight that versus the older method of just the coastal warnings. So that's probably one of the bigger changes that we're making this year. And we're making it with intent and purpose to highlight some of the things I just talked to you about.
(DESCRIPTION)
Text: Graphical Tropical Weather Outlook, Disturbances in which development is not expected. Disturbances that have a near 0% chance of development over both the next two days and the next seven days will be denoted with a gray "X" instead of a yellow "X." -- Includes systems where development chances have decreased to 0%, or are mainly being highlighted to communicate a significant rainfall/flooding threat. Disturbances that have a near 0% chance of development over the next two days but a nonzero chance over the next seven days will be denoted with a yellow "X" on the two-day products and yellow, orange or red "X" in the seven-day product. A map appears on the left, titled "Two-Day Graphical Tropical Weather Outlook, National Hurricane Center, Miami, Florida." Text on the left of the map reads: All Disturbances, Satellite Image from 10:30 AM Eastern February 9, 2026, East Pacific Outlook 11:11 AM Eastern Monday February 9, 2026. A yellow "X" labeled with the number 1 and the text "10%" appears over the Bay of Campeche, indicating a two-day cyclone formation chance of 10%. A gray X labeled with the number 2 and the text "0%" appears west of the yellow X, indicating a two-day cyclone formation chance of 0%. -- A key displays the text "Development not expected" next to a gray X.
(SPEECH)
We're also making a couple of changes on the graphical tropical weather outlook. And we just issued the first outlook of this-- not the first outlook, but the first area of interest if you've been following along of the Atlantic season this morning for an area of disturbed weather over the Bay of Campeche. So in the past, we would identify areas with one of three colors-- yellow, orange or red-- as a reflection of their overall chances of developing into a tropical depression or a named storm.
Obviously, the colors represent the probability or chance, where yellow was less than 40%, orange was 40% to 60% and red was greater than 60%. What we didn't have in the past was the ability to identify an area that we needed to say something about but had no chance of developing.
So you can imagine that this might be useful, like for the remnants of a prior system or, in this modern area of hype, in cases where-- and you've probably seen examples of this recently. The last week has given us no shortage of hype in social media, where we need to say something like, hey, we see this system.
And it has no chance of development. So those are a couple of use cases that we can use that. We haven't demonstrated this new gray X or non-colored X yet this season. But if you see it appear on our outlook at some point this season, you'll know simply why it's there.
(DESCRIPTION)
Text: Hawaiian Islands: New Storm Surge Products, Storm Surge Watches slash Warnings and Peak Surge Graphic. Storm surge operational products and warning services will be available for the main Hawaiian Islands in 2026. Storm Surge Watches and Warnings will be issued 48 and 36 hours, respectively, prior to arrival of tropical-storm-force winds if there is a risk for life-threatening storm surge. Peak Surge Graphic will be issued when a watch/warning is in effect. Potential Storm Surge Flooding Map will be made available up to 72 hours prior to landfall, dependent on forecast confidence. On the right, three graphics titled "Peak Storm Surge Forecast," "Storm Surge Warning," and "Potential Storm Surge Flooding Map (Inundation) Example" feature maps of the Hawaiian Islands.
(SPEECH)
For those of you who have interest in the Hawaiian Islands, new this year, for the first time ever, we'll be taking the entire suite of storm surge products, including the explicit storm surge warning for the first time ever to the Hawaiian Islands. These products have been available here in the continental United States since 2017. So you've probably seen examples of these issued here closer to home. But for those in Hawaii, they will get that capability for the first time ever.
And if you're asking yourself, why did it take so long? It turns out that the physics of storm surge outside of the continental United States require a different type of modeling approach, a different type of configuration and setup. And we now have the capability to provide those explicit forecast and warnings to the Hawaiian Islands with the same level of accuracy that we've had here in the continental United States. So we're really excited about that.
(DESCRIPTION)
Text: Mobile Friendly version of Hurricanes.gov. Plan for 2026: Hurricanes.gov will not change. Mobile friendly version will be hosted on the N.H.C's mobile URL: https://www dot N.H.C. dot NOAA dot gov slash mobile. -- Will work on mobile, tablet or desktop. Expected to be live around the start of the hurricane season. On the right, two screenshots capture the National Hurricane Center and Central Pacific Hurricane Center homepage at Hurricanes.gov and the new mobile friendly version.
(SPEECH)
Now, something that may be a little closer to home and a little bit more familiar to you, we have a website, hurricanes.gov. And it's remained largely unchanged for-- I don't know, maybe 10 or 15 years. And it's going to finally get a much-needed refresh, both in the aesthetic look and appearance, but also in the back end, so in the engine that is running it, if you will.
And so there will be a new mobile version of hurricanes.gov, so hurricanes.gov/mobile. So you can get it that way. Or at the very top of the website, the legacy website, you'll see a mobile link. It's up and running. You can go there right now and check it out, hopefully not all 6,000 of you at once.
But you can go check it out, see how you like it. It will scale itself to fit your screen. So if you're coming in on a phone or a tablet or your laptop, it'll refactor itself to fit that screen nicely. And you'll see a lot more mobile-friendly capabilities along with a refreshed look.
Now, we'll keep the legacy website up for those who are just familiar with it. For a lot of reasons, people get familiar with, accustomed to or bookmark certain components of our website. And we didn't want to jolt people with the season starting. So you'll see both running in tandem this year. Certainly let us know if you like something or dislike something. We tend to get a lot more opinions on dislikes. So hopefully, a couple of you will send along some positive comments.
But anyway, we're pretty excited about this because if you haven't seen the stats, most people consume information now over mobile platforms. So we want to make sure that our information is formatted and fitting nicely the way you consume it. We have a motto here at the Hurricane Center is we will meet people where they are. And since most people are on a mobile platform, we want to make sure our stuff is accessible and easy to use on a mobile platform.
(DESCRIPTION)
Text: Mobile Friendly version of Hurricanes.gov, Prototype of Refreshed Front Page. From left to right, a prototype of the refreshed front page appears on a mobile phone, tablet, and desktop.
(SPEECH)
This is sort of a synthetic way of representing how the mobile platform will scale itself to whatever medium that you're using to consume it, whether it be a phone or a tablet or desktop. It sort of reformats itself nicely to enable a clean user interface across the device size. The other thing, too, is many of you probably are familiar with our social media accounts or our video content, whether it be our livestreams or our shorter form reels that we put out.
And for a lot of people, this is their primary way of consuming information. Some people don't sit down and read a website. They consume via social media or their feeds, if you will. So we've had that content for a couple of years now. But putting it in the website allows one to have a one-stop shop. So you can get everything from the National Hurricane Center now in the new mobile platform. So that's our traditional data, our traditional products and then the social media and video content.
There's also some interesting tricks in the new mobile website that you should check out, including many of our graphics themselves have gotten a little bit of a spruce up. They're more dynamic and zoomable. And there's alternative languages in there. So you'll see a lot more Spanish and French content for anyone who is interested in that part. There's a lot in the mobile platform. And we're still rolling out certain aspects. So it'll probably get better and better as the season marches on.
(DESCRIPTION)
Text: Experimental Cone of Uncertainty, Improving the Representation. A graphic titled "Operational Circle Cone (67th percentile of absolute errors)" appears on the left, while a graphic titled "Experimental Ellipse Cone (90th percentile of along and cross-track errors)" appears on the right.
(SPEECH)
Now, I'm going to finish with probably what many of you have heard the most about in the offseason or the run-up to hurricane season, and the part that many of you are most interested in. The media tells us not to bury the lead. But I put it at the back end just to keep everybody captivated throughout the presentation.
A lot of you have heard about a new experimental cone. And this is true. The Hurricane Center has commenced a new experimental phase of the cone. While we talked about it at the beginning, adding the watches and warnings, that's more of a cosmetic or appearance aspect of the cone. Now, what we're doing is actually testing a new way of the math that creates the cone. So I'm going to start first with explaining the cone because that will be instrumental in understanding the new experimental process.
We have found over the years that a lot of people don't understand the cone. And it's insulting for them to hear that because so many people, especially in Florida, see themselves as hurricane experts but often misinterpret the cone all the time. So let's start with a basic understanding.
(DESCRIPTION)
On the Operational Circle Cone graphic, a set of animated orange circles slightly overlap as they sweep outward from a white cone's starting point to forecast times represented by black dots along the hurricane's projected path.
(SPEECH)
The old cone or the legacy cone is created by sweeping out a set of circles. So you can see in that animation, I'll make it go back, a set of circles. The circles are at each forecast time, or the black dots are a absolute five-year era. So we go back in the last five years. And we look at historically how good or bad we are.
And then, we create a circle. And that circle encapsulates the forecast 67% of the time or two out of three times. So stated more simply, the storm will stay inside of that circle two out of three times. And it will come out of that circle, one out of three times. And then, the cone is just sweeping out those circles, if you will.
I'm going to do that one more time so you can see it.
(DESCRIPTION)
The Operational Circle cone animation replays.
(SPEECH)
The circles appear in orange for each forecast time. And you can see the edge of the circle is a perfect representation of the white cone. So that's how it is created. And that's what's led to the-- sometimes we say that the center of circulation can come out of the cone one out of three times. That's where it comes from. Technically speaking, it can come out of the circle one out of three times. But for talking points and simplicity, that's generally how we described it.
Now, there's a couple problems with this that we've noticed over time. A lot of people were ascribing a level of certainty to the cone that exceeded the 67% of the time. That's No. 1. No. 2, as our forecast got better and better over the years, the circles themselves got smaller and smaller. And so the cone got smaller and smaller. So a lot of people were falling outside of the cone but still well inside of the impacts.
So if you've ever said, oh, my gosh, I'm on the edge. The cone shifted to the north. And I'm now on the edge or I'm now just outside of the cone, that is a gross mistake. So don't ever say, I'm just on the edge of the cone. That's just not the way to look at this. And we'll go back to the Milton example to prove that.
What we've done with the experimental cone is we've broken down the circle into, which is absolute error, into, not only the traditional error, which is north, south, east, west-- the center is north of me, the center is south of me-- but also, a forward speed or how quickly the storm is moving.
And it turns out that the forward speed is one of the larger contributors to the size of the circle. And so now, we can refactor accounting for the forward speed. And you get the new cone on the right. And you can see that with the circles getting a little lopsided or what we call an ellipse.
Because of this and because of some nice mathematics, we can encapsulate 90% of the certainty with this new cone and it not dramatically change. If
(DESCRIPTION)
The orange circles and ellipses disappear from the operational and experimental cones and leave the cone's white outline.
(SPEECH)
You're squinting to see the difference between those two, that's kind of by design. We didn't want to fundamentally jolt the system and shake people up.
The new cone is a little bit bigger. And I'll talk specifically in a second how bigger. The new cone is a little bit bigger. But in cases, 90% of the uncertainty-- or stated more bluntly-- there's now 90% certainty with this cone versus 67% certainty with the old cone. So think about if you had to place-- or if you had to give an adjective or a description of 90% certainty, what would you say? You would probably say highly likely or very certain or most likely.
You can ascribe higher confidence to that cone, which is just a more natural way of talking to people. It's just a more-- it's easier. It's clearer. It's a more comfortable way of communicating. The center is going to stay in this white area. We're just really, really certain of that. Whereas the old one was like most likely path, something a little bit more wishy-washy. So this is just a more natural way of communicating. And it's also how people naturally interpreted the old cone.
So now, the new experimental cone kind of better aligns with how people naturally interpret it anyway. And it didn't result in a big change. I think I have the specifics in terms of how much.
(DESCRIPTION)
Text: Experimental Cone of Uncertainty, Improving the Representation. Benefits: More accurately reflects true forecast track errors. Easier to communicate as a "likely" track area instead of a "potential." The cones are of visually similar size, but there would now be less chance of the storm center moving outside the cone. Atlantic: Averages 23% wider, Pacific: Averages 7% wider. Partially mitigates the problem of the cone getting smaller and smaller, which has lead to greater misunderstanding of expected hazards. On the left, a graphic represents an inner circle cone with a dashed red line and a slightly wider ellipse cone with a white outer cone.
(SPEECH)
There it is. It's about 23% wider in the Atlantic. If anybody's watching from the Pacific or interested in the Pacific, about 7% wider in the Pacific.
And in this visual here, you can see the differences. So the red would be a visual representation of the existing legacy column. And the white is the new ellipse column. So you can see it's a little bit bigger and a little bit longer if you will. Again, accounting for its taking into consideration the forward speed of the storm.
And if you look carefully, you'll see the differences between the cone are most pronounced at the end of the forecast, or days 3, 4 and 5. If you want to know why that is, it's because the forward speed begins to dominate the forecast uncertainty at those longer lead times. Whereas at the beginning of the forecast, they're a little bit closer. And they sort of equal weight, if you will.
(DESCRIPTION)
Text: Experimental Cone of Uncertainty, Example: Hurricane Milton (2024). On the left, an animated model tracks Hurricane Milton's movement. On the right, an experimental cone of uncertainty shows Milton's projected path. Pink inland shading indicates a hurricane watch for the majority of central Florida and yellow inland shading indicates a tropical storm watch for smaller areas to the north and south.
(SPEECH)
And if we go back to this Milton example, this is a great example about don't be enamored with the edge of the cone. So here's a great example of a situation where many of us here in Florida, while we might not have been inside of the cone, we were under some type of wind watch. In this case, the pink would have been a hurricane watch. Yellow would have been a tropical storm watch.
Again, don't look at the cone and try to derive too much. If you spend more than 10 seconds on the cone, you've probably butchered it. It's an executive summary of where the storm is now and the general direction it's going to move over the next several days. Then at that point, you move immediately to what is the impact? Or what is the hazard for me? What impacts do I have in my area?
I mean, take for example, the Florida Keys down there, well outside the cone, well, well outside of the cone, yet still solidly in the area that could experience wind impacts. So don't look at this and say, I'm inside or I'm outside of the cone. Look at this and say, what are the specific impacts or threats to my area, my community, my home?
Then, just in case we have people who are interested in international, we're going to make similar upgrades on the international front.
(DESCRIPTION)
Text: Experimental Cone of Uncertainty, Depiction of International Inland Watches and Warnings. N.H.C. will begin depicting some inland hurricane and tropical storm watches and warnings via the experimental cone. Most small island nations will be shaded with the appropriate watch slash warning type (not just a coastal depiction). Additional countries will be rolled out in phases, contingent on relevant coordination between N.H.C., other nations in the region, and technical capabilities. Underlying data layers will not be provided in 2026. A cone of uncertainty graphic on the left titled "Current Operational Methodology" features shading in the coastal regions of Cuba, whereas a graphic on the right titled "Experimental Methodology" features shading on both coastal and inland regions in Cuba.
(SPEECH)
Again, the old legacy method was basically the line along the coast. We're working with countries now to better ingest their watches and warnings, technology upgrades to do a similar, better depiction of the watches and warnings for the inland risk as well.
Now, if it felt like I spent a lot of time on watches and warnings during this talk or it feels like the Hurricane Center is putting a whole lot of effort into watches and warnings, the depiction, that is on purpose. It is the single most important thing we issue here. You can imagine that as a federal government agency, getting FCC permission to push notifications to cell phones is a big, big regulatory compliance, permission issue.
And hurricane warnings and storm surge warnings are among the few warnings issued by the Weather Service where we can physically push that information to your phone. So if any of you have ever gotten an alert comes up on your phone, it says you're under a hurricane warning, you're under storm surge warning, that's issued by us.
And that's a big deal when we make that step. I mean, that's effectively a meteorologist yelling, that's how important it is. And if they don't come to your phone, you may have that capability turned off. So make sure you turn it on, at least for hurricane season or when you're under an active weather threat to make sure you're getting the latest information on your phone.
And I think that is my last slide. So I will stop there.
JESSICA KEARNEY: Jamie, thank you. That was fantastic. A really great overview and an introduction to so many of the professionals on the line that come from the risk management and insurance community. Some of the headlines I heard, El Niño is not the only game in town. You've already pulled out your generators.
I want to dig into that a little bit more and what people can do, really listen to the watches and warnings. And I think the time spent describing and understanding the cone and what it means is always a great reinforcement on education. And hurricanes.gov, for all of the listeners on the phone, just to get acclimated to that website and use it as a resource.
So I think here at the Travelers Institute, we've taken folks behind the scenes at lots of research, nonprofit, governmental organizations that really cross with interest here in the insurance industry. So we've looked at the Insurance Institute for Business and Home Safety, IIHS on the auto side.
Could you take us behind-- you-- you showed us the range of products that come out of the National Hurricane Center. Can you peel the curtain back a little? What's it like to work at the center? And who are the people that are making this all happen behind the scenes?
JAMIE RHOME: Well, we're not as big as people think. Everybody who visits here, they think it's sort of like a NASA command center type thing. We're probably a staff of about 50, which stuns people how small we are. And that size is important because there's only a handful of experts in the world that do this, at least formally, professionally for the government. This is the National Hurricane Center. There's not another National Hurricane-- this is-- it's the only one in the federal government.
We cover everything from Africa to all the way out to Hawaii, including international. We have international responsibilities under the U.N. So to answer your question, what it's like? Well, I mean, it's quite intense, as you can imagine, high visibility, high stakes, unlike others who put information out there.
We're held accountable by Congress and the American people. So if we make a mistake, we're going to hear about it. And that's why we argue that our information is often the most trustworthy, reliable, credible information because we don't make a profit. We're not making a profit in any of this. And I assure you, if we make a mistake, we're going to hear about it in no uncertain terms. So that keeps us honest, if you will.
In terms of what it's like in a typical day during season, as you can imagine, long, long hours. All of us are on call 24 by 7. In some cases, like last night, watching a hockey game, for me got interrupted by technical issues. So you're always sort of perched and ready to go and on call at least for six months out of the year.
And then for the rest of the six months, you're doing development. You're trying to learn from the past season, learn from science, see what we can do better, and advance the system and enterprise for the following year.
JESSICA KEARNEY: Yeah, that's fascinating. And as we just saw, kind of what came out of the offseason work and came out this year with all the new products. We've had some interesting recent hurricane seasons. I know in 2025, there were five hurricanes. But none of them made landfall here in the United States. Meanwhile, there was a massive hurricane that made landfall in Jamaica to devastating effects there. Can you talk about some of your, I guess, biggest lessons learned from the last few seasons?
JAMIE RHOME: Yeah, so we've been in no shortage of hurricane activity over the last 12 years. Some of our forecasters have received a lifetime's worth of experience over the last couple of seasons just because they get so many reps at it. Hurricanes tend to run in 30-year cycles. And so we're still sort of in that active period, if you will.
And then, because the Atlantic has been warm, the ocean temperatures have been warm, we've seen a lot of activity. We've seen a lot of rapid intensification cases of late. And I think from a preparedness perspective, for our audience, for your audience, for the people listening, they have this mindset that there's some sort of disturbance.
A tropical wave is going to move across, move off Africa. And we're going to sit and watch it for 10 or 12 days as it saunters over the Atlantic. We slowly kind of ramp up. We slowly kind of get situated, this sort of stuff. That's really no longer the business case. What we're seeing is these storms are going from disturbance or tropical storm phase to major hurricane literally overnight and often on your doorstep.
So what we're trying to teach people is the old mantra of you got three or four days to get prepared or get moving is gone. And so if your timeline is three days, you need to redo it. Period. Full stop. Because I'm going to tell you a secret about major hurricanes. And nobody will tell you this.
They're fragile. Major hurricanes are very, very fragile. Meaning, any little thing is going to disrupt or upset or weaken it. So the only way to get hit by a major hurricane is for it to rapidly intensify right before it hits you. So think about and digest that. The only way for a Category 5 to hit the United States is for it to rapidly intensify before it hits land. Because it can't hang on to Category 5 status for long. It's just too fragile. They can only hang on for a small bit of time.
So this means that the worst offending hurricanes are always going to come with very little lead time, very little. You're not going to run out and buy insurance. You're not going to run out and buy supply-- you're not going to be able to do all of these things because a million of your closest friends are going to be trying to do the exact same thing on the exact same roads and the exact same gas stations and the exact same grocery stores.
So increasingly, we're having a tough time getting people to prepare ahead of hurricane season. They all want to go out and just do it at the last minute. And it's just not physically possible the way these storms are manifesting themselves.
JESSICA KEARNEY: That is a great insight. And I'm just scanning the audience questions here. And we're getting a few questions as to that 30-year cycle that you just mentioned. What's behind the science there?
JAMIE RHOME: They just run in 30-year periods. We call it a multi-decadal cycle. Now, you're going to hear all sorts of people tell you all sorts of things about hurricanes and increasing or decreasing or this or that. And I don't want to get into too much of a political debate over that. All I can tell you is that, scientifically, they run in 30-year cycles. And we're in a 30-year active period.
And then, obviously, as things get warmer, as the globe gets warmer, that's also going to have a positive impact or negative impact depending on your perspective on these storms. So there's a lot that has come together in time and space over the last 10 years to give us this very, very active period. And I don't think we've cleared it yet.
And so that's why I really-- and many of you have heard me talk before. And you've heard me get on this soapbox before. Don't get too enamored with the El Niño headlines. One of the worst hurricanes to hit Florida hit during an El Niño year, 1992, Andrew. I can pull case after case after case of devastating hurricanes that hit during El Niño years.
JESSICA KEARNEY: So the bottom line there is we always have to be ready. We always have to be prepared. You mentioned at the top of the hour that you pulled out your two generators. What are some of the other things that you and the team at the NHC do in your personal lives just to get ready that you might recommend folks think about?
JAMIE RHOME: Well, because of the immense personal responsibility that we carry here at the Hurricane Center, I can't have my staff running around standing in lines trying to get groceries and supplies. So we instill upon them the necessity of preparing before hurricane season so that when it's time for you to forecast, when it's time for you to be here, you got to be here. And in some cases, 18, 20 hours. We need you here.
So they have to be prepared. They just have to be prepared. And that level of preparedness is something we hope is a good role model for the rest of-- we're serving as good role models. We're practicing what we preach. I've gone through-- I'll give you an example. I have accordion shutters on my home, the metal ones that you close or whatever.
I went through the previous weekend and tried to shut all of them one by one. And a couple of the handle locks broke off. I had to order new locks and install them this past weekend. Imagine if I was doing that, the stress and run-up of-- I couldn't get the supplies. I couldn't get them. What have you?
How many of you have physically gone through the process of making sure all of your supplies are there? Batteries tend to walk off in the offseason. Your kids go and get them and put them in their electronics. There's all these things that people don't think about. Prescriptions, are your prescriptions up to date? What are you going to do with your pets? Where are you going to go? Are you in an evacuation zone?
All these things that everyone tries to do at the last minute when they're under severe duress, and it's just really hard to think clearly, when a major hurricane is bearing down upon you.
JESSICA KEARNEY: Absolutely. That reminds me of a lot of what we talk about in cybersecurity. Always say, back up all of your systems, back up all of your data. But if you don't test the backup and make sure that you can access it and that it's working, then it really does you no good. So that's really good advice.
You mentioned El Niño in the headlines. Something else that got a lot of headlines over the past year was the incorporation of AI into the forecasting model. Could you talk a little bit more about that?
JAMIE RHOME: Yeah, I'm going to disappoint a lot of you here. It's not nearly as big of a deal as the media is making it out. We have been using AI for-- we've tracked it back several decades. Now, obviously, the depth and degree of machine learning has grown substantially. So I'm not trivializing that.
But we've been using AI. I was using it when I was a forecaster. And that feels like, the dark ages ago. So I mean, we've been using AI for a long time here. So I have a saying. It's an evolution, not a revolution. Now, some of the newer AI techniques are proving to be quite accurate. Some of that narrative is true. But I don't want people to think that this is some huge jolt in the system.
Our forecasters have been using AI for a long time. They're quite comfortable with it. AI is not replacing the human. The human is still quite good at this. And so it's important to us. It's helping to make the forecast more accurate. But it's not nearly of a jolt or a paradigm shift than-- as you might read about in the news.
JESSICA KEARNEY: Got it. Got it. I want to talk about storm surge because I mentioned your expertise in that area in the beginning. Can you talk to us a little bit about why that is such an important component when we talk about hurricane and preparedness? And what we've learned about it in recent storms?
JAMIE RHOME: Yeah, historically, it's been the No. 1 killer in a hurricane. Now, owing to the advances in warnings and forecasting, we've brought mortality substantially down, substantially. So now, inland flooding from rain is one of the-- is the leading cause of death in hurricanes. But more importantly-- and so few people know this. I'm going to shock people with this one.
Whether you are asked to evacuate or not is due entirely to storm surge. It has nothing to do with the Saffir-Simpson Scale. It has nothing to do with how strong the wind speeds are. It's due entirely to storm surge. And whether you're in an evacuation zone or not is mapped ahead of time based off storm surge risk.
Another inside the ballpark, you asked what it's like at the Hurricane Center. A lot of people don't realize this, but the Hurricane Center does all of the risk modeling and mapping that goes into establishing every hurricane evacuation zone in this country. So all of the modeling capabilities, that's done here at the National Hurricane Center. Those evacuation zones are set in advance of hurricane season. So whether you are or not in a hurricane evacuation zone is due to the science here.
And a hurricane evacuation zone is not a 100-year flood, is not a flood zone that determines whether you do or do not carry flood insurance. That's an entirely different thing.
If I could fix that one thing, the misunderstanding between 100-year flood and flood insurance and people's risk, I could probably retire off of that accomplishment. It's one of the biggest things that is impeding understanding of flood risk in this country.
JESSICA KEARNEY: Yeah, that is an excellent point. I know we are close to reaching the top of the hour. And I want to make sure I get in a few more audience questions. We have a question coming in from Debbie in Washington state. She wants to know, besides AI, what do you think is the single biggest improvement in hurricane forecasting in the recent past?
JAMIE RHOME: So our ability to predict rapid intensification. So rapid intensification is when a storm goes from a weak storm to a very strong storm in a matter of hours. We used to be able to observe this but not forecast it. Our ability to forecast these things-- and you mentioned Melissa earlier-- the rapid intensification forecast at an early lead time-- I mean like two or three days in advance-- stunned us all because it's a massive step forward in predictability and communication. That is a remarkable step forward.
Some of the newer-- so you know what a radar is, weather radar. We have similar radars on our Hurricane Hunter aircraft. We're learning how to use that data to spot the early signs of these rapid intensifiers. So our forecasters are just getting really, really good at identifying the storms that are going to develop quickly and boldly make those forecasts.
JESSICA KEARNEY: And actually, the next question I was going to ask you, coming in from Brian, was about that Hurricane Hunter aircraft. He wants to know if you've been able to go up in it. And if you could talk a little bit more about that technology and how it helps you with the forecasting.
JAMIE RHOME: So I've been in the aircraft several times but not to the extent that the question is framed. The question is framed of in a hurricane. So never in a hurricane, obviously I'm strapped here during-- when they're flying, I'm strapped here. But to answer your question, most cases are relatively benign and calm. It's not that bad. And then occasionally, there are storms that are quite, quite bad. I would say about one out of 20 missions, it gets quite rough.
And normally, these are the cases where the storm is going up rapidly, going from weak to strong quickly. A storm that's already a Cat 5 is not necessarily rough, although people assume that. It's the ones that are going from weak to strong quickly that are generally the roughest or the ones that are encountering land. So as a major hurricane approaches land, they tend to get really, really rough.
You've heard of the phrase g-forces or pulling G's. We can have cases where planes experience easily 3 and 4 G's. And so put that in perspective, if you hit those types of conditions, things in the aircraft levitate. And so it's a wild ride in those rare cases where it is rough. But more often than not, it's relatively benign and calm.
JESSICA KEARNEY: But that is definitely a help in terms of data collection. And I imagine-- I know there's other technologies that you use to collect data as well.
JAMIE RHOME: Yeah, I mean, I can say it the scientific way. It's instrumental. We need it. But to put it in more relatable terms, when aircraft is en route to a storm or a system, everybody in the building knows the status of that aircraft and when it will be on scene. Like, we all track it.
We all know it's one hour out. It's 30 minutes out. It's turning. It's coming back. It's coming back around. It's about to enter the eye. That's how critical the data is to us. We're basically hanging on every data stream that comes in. It's just-- I cannot put into words how valuable the data is to us.
And another question that's probably going to come up, these missions are off-- there's humans driving these aircrafts. And a lot of people ask, well, why don't you put unmanned or drone aircraft in there? As of right now, the drones cannot fulfill the mission assignments that we need, the flying assignments that we need. However, we are testing deploying the drones from the manned aircraft. And the two pieces of technology moving, working in tandem are really, really, really promising.
JESSICA KEARNEY: That's fascinating. One more question, we're at the top of the hour. And you've been so kind to give us your time, especially during this very busy time of year for you. If you could leave our audience just with one final thought, as we're looking ahead to the 2026 season, what would you like to share?
JAMIE RHOME: The preparation and mitigation is the No. 1 thing. I mean, literally, I mean, if you come to my house, you will see all the modern building design aspects. I just put on a metal roof. So I've got full wind mitigation on the house, double straps for the engineers out there.
I have two forms of fuel for the generator in case I lose one. Two generators, one’s backup. And just full mitigation-- obviously, you need to insure yourself. It's one of the No. 1 things you can do to prepare for any type of weather hazard. And just to the extent that you can forward the necessary mitigation strategies, it's the single most important thing you can do.
JESSICA KEARNEY: I think that was a wonderful note to leave it on, Jamie. Thank you so much for your time. Thank you for all that you and your team do at the National Hurricane Center. I know on behalf of our industry and all of our customers, we so appreciate it. Thank you so much for your time today.
JAMIE RHOME: Thank you.
JESSICA KEARNEY: All right. Well, thank you for all being with us. That was a fantastic hour that just flew by.
(DESCRIPTION)
Text: Wednesdays with Woodward (registered trademark) Webinar Series. Take Our Survey. Link in chat.
(SPEECH)
As always, we're going to drop a link to our survey in the chat. So please let us know what you learned today. If there was anything that jumped out at you that you're going to take back to your office and to your colleagues and to your customers, we'd love to hear that as well. And so please take our survey.
(DESCRIPTION)
Upcoming Programs. June 17, Take the Stage: Leadership Confidence That Builds Trust and Connection. July 15, A Tale of Two Economies with Marisa DiNatale of Moody's. Register: Travelers Institute dot org. Logos: Travelers Institute (registered trademark), Travelers.
(SPEECH)
And we hope you'll also join us for some upcoming programs in the next few weeks. We've got some really great sessions coming up. Next week on June 17, we're going to have a very practical session on showing up with trust and a powerful presence at work. We're going to be joined by Pam Sherman, a leadership consultant and author, among many other roles, to talk through that with you all.
And then on July 15, we're pleased to welcome back one of our colleagues from Moody's, Marisa DiNatale for an economic outlook. I know those are always popular with our audience. We'll get a latest look at the labor markets, energy prices, geopolitics, interest rates and more. So be sure to join us on July 15.
(DESCRIPTION)
Wednesdays with Woodward (registered trademark) Webinar Series. Watch: Travelers Institute.org. Logo: Linked In. Text: Connect, Joan Kois Woodward. Travelers Institute Risk and Resilience, Listen wherever you get your pods.
(SPEECH)
As always, visit us at travelersinstitute.org. For registration, replays and more, check out our podcast, The Travelers Institute Risk and Resilience podcast, where we do replays of webinars like the one today and other content. And thanks again for tuning in with us and the National Hurricane Center and Jamie Rhome. We will see you next week. Thanks so much.
[MUSIC PLAYING]
(DESCRIPTION)
Logos: Travelers Institute (registered trademark). Travelers. Travelers Institute.org.
Summary
What did we learn? Here are the top takeaways from Inside the National Hurricane Center: Advanced Forecasting, Better Preparedness:
The NHC is introducing changes to how it communicates hurricane risks this season.
The NHC relies on a staff of about 50, including renowned hurricane experts, who are on call 24/7. “It’s high visibility, high stakes,” Rhome said, noting that as a nonprofit accountable to Congress and the American people, the NHC serves as one of the most reliable sources of hurricane information. This year, the NHC will introduce a mobile-friendly version of its website on a mobile URL and will begin featuring inland watches and warnings on the NHC Track Forecast Cone, a graphic that shows the probable track of the center of a hurricane. The biggest change: The agency will roll out an experimental version of the cone that provides 90% certainty, up from 67% previously, according to Rhome. “This is a more natural way of communicating, and it’s also how people naturally interpreted the old cone,” he said. Watch at 09:40
According to U.S. government data, there is a 90% chance of a near normal or below normal Atlantic hurricane season this year, but preparation is still imperative.
Modeling for 2026 predicts eight to 14 named storms, three to six hurricanes and one to three major hurricanes, according to figures from the National Oceanic and Atmospheric Administration (NOAA) and Weather.gov. In contrast, the years from 1994 to 2020 had an average of 14 named storms, seven hurricanes and three major hurricanes per season. However, Rhome thinks too much emphasis is being put on the effect of this year’s strong El Niño, a naturally occurring climate phenomenon characterized by unusually warm ocean surface temperatures in the central and eastern tropical Pacific Ocean that some say could suppress hurricane formation and keep storms away from the U.S. He notes that El Niño is only one of many factors, including rising ocean temperatures, that affect seasonal hurricane activity. “Don’t get distracted by the headlines of this massive, historic, first-of-its-kind, never-recorded El Niño, because that’s going to cause you to be distracted and not be prepared,” he stressed. Watch at 04:07
Major hurricanes can hit with very little warning, even in an El Niño year.
“Scientifically, hurricanes run in 30-year cycles and we’re in an active period,” Rhome said. He pointed out that major hurricanes can happen in an El Niño year – for example, 1992’s Hurricane Andrew, one of the worst in history. Because hurricanes are fragile, a Category 5 hurricane hits when a storm intensifies rapidly right before making landfall, he said. “The worst hurricanes are always going to come with very little lead time,” he added. One helpful tip: Make sure your phone can get National Weather Service wireless emergency alerts, as hurricane and storm surge warnings are among the few notifications the NWS can push to your phone. “That’s a big deal when we take that step,” he said. Watch at 36:09
Storm surge, an abnormal rise in water level from a storm’s wind, was once the leading cause of hurricane deaths, but more advanced forecasting, earlier warnings and higher evacuation rates have helped drive that number down.
Today, inland flooding from rain poses the greatest threat to lives. However, the threat of storm surge still demands attention. Evacuation zones, Rhome explained, are determined entirely by storm surge risk – not wind speed, not the Saffir-Simpson Hurricane Wind Scale. And confusing hurricane evacuation zones with flood insurance zones is one of the biggest obstacles to accurate risk understanding in the country, he stressed. Watch at 44:30
Preparation and mitigation strategies are key for the 2026 hurricane season and beyond.
Making sure you’re properly insured is crucial, Rhome said, emphasizing that it’s essential to understand your flood risk and flood insurance needs. Performing mitigation on your home to the extent you can afford to also is important, he said. For example, his own house has a metal roof, full wind mitigation, a generator, a backup generator and two forms of generator fuel. Before hurricane season, Rhome tested both of his generators and checked every accordion shutter on his home, a drill that turned up a few broken handle locks that he wouldn’t have had time to replace if a storm had been approaching. It’s also necessary to keep emergency food and supplies on hand rather than rushing out at the last minute to stock up, he said. “A million of your closest friends are going to be trying to do the exact same things on the exact same roads, in the exact same gas stations and grocery stores,” he said. He added: “Preparing for any type of weather hazard is the No. 1 thing you can do.” Watch at 51:37
Webinar resources
- Learn more about the National Hurricane Center’s products and services for keeping the public aware of hurricane threats.
- Explore the National Hurricane Center’s tour videos and outreach resources.
- Plan ahead for disasters, including hurricanes, by visiting Ready.gov.
- Get more information on storm surge.
Speaker
Jamie Rhome
Deputy Director, National Hurricane Center
Host

Jessica Kearney
Vice President, Public Policy, Travelers Institute
Presented by





Related content
Live from the CAT Center: Where Expertise Meets Innovation
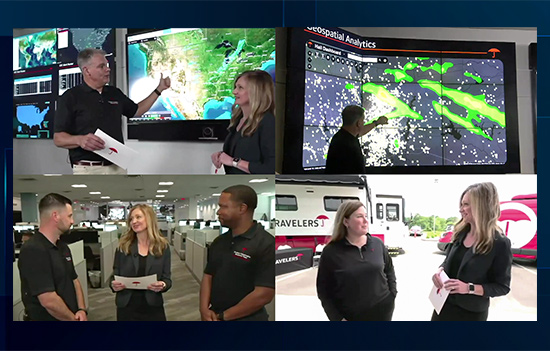
Viewers joined us in the Travelers National Catastrophe Center to learn how we monitor weather, risk and exposure in real time, and how our industry-leading AI and machine-learning tools help us assess damage quickly, ensuring we deliver on our promise to our customers.
Wind, Hail, Rain, Fire: LIVE from IBHS!
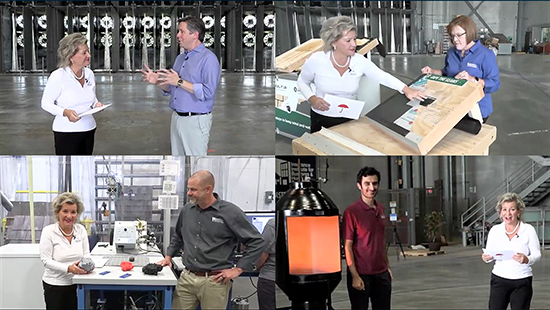
We got an exclusive live tour of the Insurance Institute for Business & Home Safety (IBHS) Research Center. Check out its wind and hail simulators, fire-testing labs and more.
Storm Warning: Managing the Risk of Increasing Hurricane Catastrophes
In this webinar session, which included leading authorities in hurricane, storm surge and risk mitigation, we explored how to help mitigate the risk of hurricanes and storm surge.